
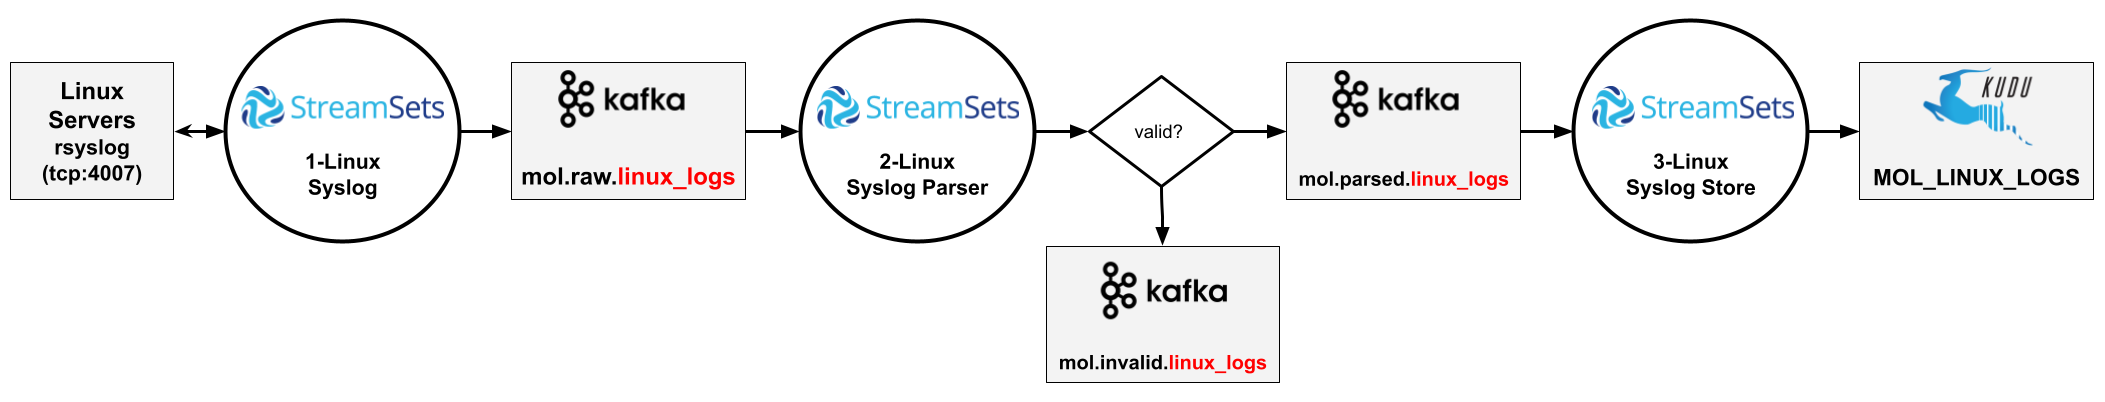
No-code History: The Geometry Theorem Machine (1959)

/galleries/post-images/nocode-history-geometry-machine/geometer-machine-1.png

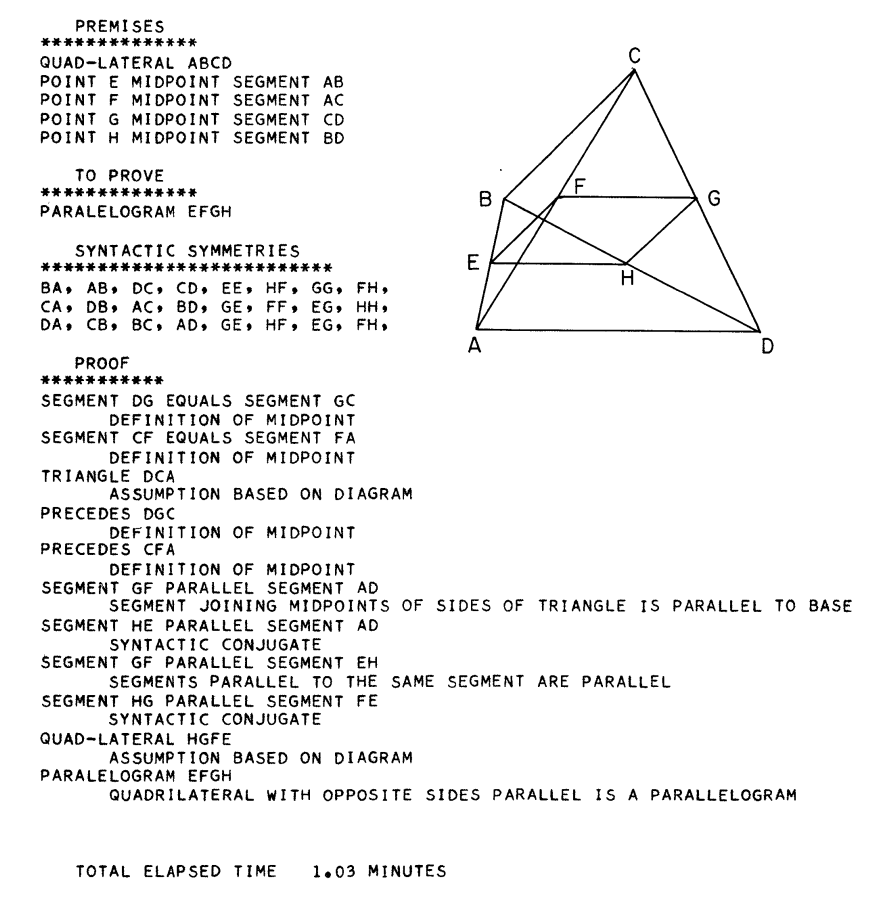
Geometry machine proving PARALELOGRAM EFGH

Preface

In the process of finding and sorting the history of a field one has to define a "starting point" and a set of criteria to filter what is and isn't part of the field being studied.

This series of posts is an attempt at finding both the starting point and the filter criteria, which as the series progresses hopefully will be clear enough to be shared publicly.

I find the following papers a good approximation to a starting point, the lack of a visual interface is mostly the result of technology limitations, as the papers say:

The behavior of the system would not be changed if the diagram computer were replaced by a device that could draw figures on paper and scan them.

...

Our first system does not "draw" its own initial figure, but is, instead, supplied with the diagram in the form of a list of possible coordinates for the points named in the theorem.

...

Like the human mathematician, the geometry machine makes use of the potent heuristic properties of a diagram to help it distinguish the true from the false sequences.

Note: Almost all text below are quotes from resources listed at the end with slight editions, emphasis mine, personal comments are lines starting with 💭

Introduction

In early spring, 1959, an IBM 704 computer, with the assistance of a program comprising some 20,000 individual instructions, proved its first theorem in elementary Euclidean plane geometry. Since that time, the geometry-theorem proving machine has found solutions to a large number of problems taken from high-school textbooks and final examinations in plane geometry.

Some of these problems would be considered quite difficult by the average high-school student. In fact, it is doubtful whether any but the brightest students could have produced a solution for any of the latter group when granted the same amount of prior "training" afforded the geometry machine.

The geometry machine is able to discover proofs for a significant number of interesting theorems within the domain of its ad hoc formal system (comprising theorems on parallel lines, congruence, and equality and inequality of segments and angles) without resorting to a decision algorithm or exhaustive enumeration of possible proof sequences.

Motivation

The research project which had as its consequence the geometry-theorem proving machine was motivated by the desire to learn ways to use modern high-speed digital computers for the solution of a new and difficult class of problems.

In particular, we wished to make our computer perform tasks which are generally considered to require the intervention of human intelligence and ingenuity for their successful completion.

If we restrict the universe of problems to the discovery of a proof for a theorem in some well-defined formal system, then the distinguishing characteristics of those problems of special interest to us are brought clearly into focus.

The Language

The following theorem is proved in less than a minute.

Theorem: A point on the bisector of an angle is equidistant from the sides of the angle:

Premises

Angle ABD equals angle DBC
Segment AD perpendicular segment AB
Segment DC perpendicular segment BC

Definition

Right angle DAB
Right angle DCB

Syntactic Symmetries

CA, 88, AC, DD

Goals

Segment AD equals segment CD

Solution:

Angle ABD equals angle DBC
    Premise
Right angle DAB
    Definition of perpendicular
Right angle DCB
    Definition of perpendicular
Angle BAD equals angle BCD
    All right angles are equal
Segment DB
    Assumption based on diagram
Segment BD equals segment BD
    Identity
Triangle BCD
    Assumption based on diagram
Triangle BAD
    Assumption based on diagram
Triangle ADB congruent triangle CDB
    Side-angle-angle
Segment AD equals segment CD
    Corresponding elements of congruent triangles are equal

Total elapsed time = 0.3200 minute

In less than five minutes, the machine is able to find the attached proof, which requires the construction of an auxiliary segment.

Theorem: In a quadrilateral with one pair of opposite sides equal and Parallel, the other pair of sides are equal:

Premises

Quad-lateral ABCD
Segment BC parallel segment AD
Segment BC equals segment AD

CA BA DA
DB AB CB
AC DC BC
BD CD AD

Goals

Segment AB equals segment CD

I am stuck, elapsed time = 0.88 minute

Construct segment DB
Add premise segment DB
Restart problem

Solution:

Segment BC parallel segment AD
    Premise
Opp-side CADB
    Assumption based on diagram
Segment DB
    Premise
Angle ADB equals angle CBD
    Alternate interior angles of parallel lines
Segment BC equals segment AD
    Premise
Segment BD equals segment DB
    Identity
Triangle CDB
    Assumption based on diagram
Triangle ABD
    Assumption based on diagram
Triangle ABD congruent triangle CDB
    Side-angle-side
Segment AB equals segment CD
    Corresponding elements of congruent triangles

Total elapsed time = 4.06 minutes

How it Works

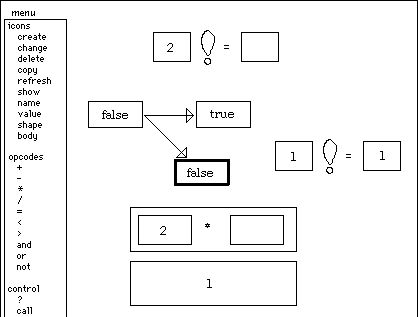
💭 The use enters the definition of a geometric shape and asks the system to prove a statement, the system will either provide the proof or inform that it's "stuck" and needs more definitions to continue. At the end the proof is provided.

Theory

Just as manipulation of numbers in arithmetic is the fundamental mode of operation in contemporary computers, manipulation of symbols in formal systems is likely to be the fundamental operating mode of the more sophisticated problem-solving computers of the future.

It seems clear that while the problems of greatest concern to lay society will be, for the most part, not completely formalizable, they will have to be expressed in some sort of formal system before they can be dealt with by machine.

Like the human mathematician, the geometry machine makes use of the potent heuristic properties of a diagram to help it distinguish the true from the false sequences.

Although the diagram is useful to the machine in other ways as well, the single heuristic "Reject as false any statement that is not valid in the diagram" is sufficient to enable the machine to prove a large class of interesting theorems, some of which contain a certain trivial kind of construction.

A heuristic is, in a very real sense, a filter that is interposed between the solution generator and the solution evaluator for a given class of problems.

The first requirement for such a filter is a consequence of the fact that its introduction into the system is never costless. It must, therefore, be sufficiently "nonporous" to result in a net gain in problem-solving efficiency.

Secondly, a heuristic will generally remove from consideration a certain number of sequences that are quick and elegant solutions, if not indeed all solutions, to some potential problems within the domain of the problem-solving machine.

The filter must, then, be carefully matched to that subclass of problems in the domain containing those that are considered "interesting," and are therefore likely to be posed to the machine.

The decisive point in favor of geometry was the great heuristic value of the diagram. The creative scientist generally finds his most valuable insights into a problem by considering a model of the formal system in which the problem is couched. In the case of Euclidean geometry, the semantic interpretation is so useful that virtually no one would attempt the proof of a theorem in that system without first drawing a diagram; if not physically, then in the mind's eye.

Trivia

The geometry machine is in reality a particular state configuration of the IBM 704 electronic Data Processing Machine.

In order to ease the task of writing so massive and complex a machine code, a convenient special-purpose list processing language was designed to be compiled by the already available FORTRAN system for the IBM 704 computer. The authors feel that had they not made free use of an intermediate programming language, it is likely that the geometry program could not have been completed.

💭 The language mentioned is a precursor of LISP called Information Processing Language (1956)

Resources

See Also

No-code History: Pygmalion (1975)

Note: Almost all text below are quotes from resources listed at the end with slight editions.

/galleries/post-images/nocode-history-pygmalion/01Pygmalion22.jpg

Pygmalion being used to define factorial

Introduction

Pygmalion was an early attempt to improve the process of programming.

By studying how people think and communicate, it attempted to build a programming environment that facilitated communication and stimulated people's ability to think creatively.

While it never went beyond a toy system, Pygmalion embodied some ideas that still seem to have promise today:

  • It allowed ideas to be worked out via sketches on the screen and then was able to reexecute the sketches on new data.

  • It introduced icons as the basic entity for representing and controlling programs.

  • Programming was done by editing sketches and then recording the editing actions. This avoided the abstract step of writing down statements in a programming language.

  • Example data were always concrete, never abstract.

  • It used analogical representations for data. This reduced the translation distance between mental models and computer models of data.

  • It represented programs as movies.

Motivation

Its design was based on the observation that for some people blackboards provide significant aid to communication.

If you put two scientists together in a room, there had better be a blackboard in it or they will have trouble communicating.

If there is one, they will immediately go to it and begin sketching ideas. Their sketches often contribute as much to the conversation as their words and gestures. Why can't people communicate with computers in the same way?

Pygmalion was an attempt to allow people to use their enactive and iconic mentalities along with the symbolic in solving problems.

The Language

Pygmalion is a two-dimensional, visual programming environment.

It is both a programming language and a medium for experimenting with ideas. Communication between human and computer is by means of visual entities called "icons," subsuming the notions of variable, data structure, function and picture. Icons are sketched on the display screen.

The heart of the system is an interactive "remembering" editor for icons, which both executes operations and records them for later reexecution. The display screen is viewed as a picture to be edited.

Programming consists of creating a sequence of display images, the last of which contains the desired information.

In the Pygmalion approach, a programmer sees and thinks about a program as a series of screen images or snapshots, like the frames of a movie.

One starts with an image representing the initial state and transforms each image into the next by editing it to produce a new image. The programmer continues to edit until the desired picture appears. When one watches a program execute, it is similar to watching a movie. The difference is that, depending on the inputs, Pygmalion movies may change every time they are played.

How it Works

Below is a video demonstration:

The user creates programs by editing graphical snapshots of the computation. Essentially the user treats the display screen as an "electronic blackboard", using it to work out algorithms on specific concrete examples

Partially specified programs could be executed. The system asks the user what to do next when it reaches the end of a branch.

A person would define factorial by picking some number, say "6", and then working out the answer for factorial(6) using the display screen as a "blackboard."

The user invokes the "define" operation, and types in the name "factorial."

The first thing the system does with a newly created function is to capture the screen state.

Whenever the function is invoked, it restores the screen to this state. This is so that the function will execute the same way regardless of what is on the screen when it is called.

Icons may be deliberately left on the screen when a function is defined; these act as global variables. When the function is invoked, the "global" icons and their current values are restored to the screen and are therefore available to the function.

Whenever all the arguments to a function are filled in, the system immediately invokes it.

Functions in Pygmalion can be invoked even if their code is undefined or incomplete. When the system reaches a part of the function that has not yet been defined, it traps to the user asking what to do next.

The process will repeat until all parts are specified and the program can run to completion.

Finally, it restores the screen to its state when the function was initially invoked.

Retrospective

There are three main things the author would do differently:

  • Address a broader class of users. Pygmalion was designed for a specific target audience: computer scientists. These people already know how to program, and they understand programming concepts such as variables and iteration. Would like to see if the approach could be applied to a wider audience: business people, homemakers, teachers, children, the average "man on the street." This requires using objects and actions in the conceptual space of these users.

  • The biggest weakness of Pygmalion, and of all the programming by demonstration systems that have followed it to date, is that it is a toy system. Only simple algorithms could be programmed. The biggest challenge for programming by demonstration efforts is to build a practical system in which nontrivial programs can be written.

  • Put a greater emphasis on the user interface. Given what we know about graphical user interfaces today, it wouldn't be hard to improve the interface dramatically. Good esthetics are an important factor in the users' enjoyment of a system, and enjoyment is crucial to creativity.

Theory

Writing static language statements interspersed with compile-run-debug-edit periods is obviously a poor way to communicate. Suppose two humans tried to interact this way! Specifically, it is poor because it is:

Abstract

The programmer must mentally construct a model of the state of the machine when the program will execute, and then write statements dealing with that imagined state.

We must find a way to allow programmers to work with concrete values without sacrificing generality.

Non-interactive

Instead of speeding up the debug-edit-recompile loop, programmers should eliminate it!

"Fregean"

The most articulate representation for a program requires the least translation between the internal representation in the mind and the external representation in the medium.

Aaron Sloman distinguishes two kinds of data representations: "analogical" and "Fregean".

  • Analogical representations are similar in structure to the things they describe

  • Fregean representations have no such similarity.

One of the advantages of analogical representations over Fregean ones is that structures and actions in a context using analogical representations (a "metaphorical" context) have a functional similarity to structures and actions in the context being modeled.

Jerome Bruner, in his pioneering work on education, identified three ways of thinking, or "mentalities":

Enactive

in which learning is accomplished by doing. A baby learns what a rattle is by shaking it. A child learns to ride a bicycle by riding one.

Iconic

in which learning and thinking utilize pictures. A child learns what a horse is by seeing one or a picture of one.

Symbolic

in which learning and thinking are by means of Fregean symbols. One of the main goals of education today is to teach people to think symbolically.

All three mentalities are valuable at different times and can often be combined to solve problems. All three skills should be preserved.

Trivia

Pygmalion is the origin of the concept of icons as it now appears in graphical user interfaces on personal computers.

After completing his thesis, David Canfield Smith joined Xerox's "Star" computer project. The first thing he did was recast the programmer-oriented icons of Pygmalion into office-oriented ones representing documents, folders, file cabinets, mail boxes, telephones, wastebaskets, etc.

Pygmalion was implemented in Smalltalk on a computer wht 64 Kilobytes of RAM and no virtual memory.

Resources

See Also

McMansion Software Architecture

Kate Wagner's blog McMansion Hell "hopes to open readers’ eyes to the world around them, and inspire them to make it a better one" by "making examples out of the places we love to hate the most: the suburbs."

The main target is what's called McMansion, from Wikipedia:

The term "McMansion" is generally used to denote a new, or recent, multi-story house of no clear architectural style, which prizes superficial appearance and sheer size over quality.

In McMansions 101 Revisited: Aesthetics Aside, Why McMansions Are Bad Architecture Kate writes:

The inside of McMansions are designed in order to cram the most “features” inside for the lowest costs. Often this is done inefficiently, resulting in odd rooflines, room shapes, and hastily covered up contractor errors. These lead to major upsets years down the road such as leaky roofs, draft problems, and structural deficiencies leading to mold, mildew, and other problems costing thousands of dollars to repair.

The reason to cram the most "features" for the lowest cost is because McMansions are not built to be homes, they’re built to be short-term investments:

Because we started treating our houses as disposable during the mortgage booms of the 1980s, 90s and 2000s, we ended up with houses built to last not even 25 years.

But it seems we are starting to notice: McMansions are a seriously bad investment

I propose the term McMansion Software Architecture: replace "house" with "software project" and "investment" with "career building" (which is a kind of personal investment).

📚 Instadeq Reading List October 2021

Here is a list of content we found interesting this month.

The Ongoing Computer Revolution

Most people thought it was crazy to devote a whole computer to the needs of one person—after all, machines are fast and people are slow. But that’s true only if the person has to play on the machine’s terms. If the machine has to make things comfortable for the person, it’s the other way around. No machine, even today, can yet keep up with a person’s speech and vision.

Today’s PC is about 10,000 times as big and fast as an Alto. But the PC doesn’t do 10,000 times as much, or do it 10,000 times as fast, or even 100 x of either. Where did all the bytes and cycles go? They went into visual fidelity and elegance, integration, backward compatibility, bigger objects (whole books instead of memos), and most of all, time to market.

Im constantly amazed at the number of people who think that there’s not much more to do with computers. Actually, the computer revolution has only just begun.

👤 Butler Lampson

📝 The Ongoing Computer Revolution

Some Thoughts on Interfaces

We want to instantly grasp how to use interfaces without any instruction, even as we hope to be able to solve increasingly complex problems. One of the great myths of interface design is that all interfaces must be simple, and that everything should be immediately intuitive. But these aims are often contradictory - just because something is simple in its visual layout does not mean it will be intuitive! Intuitiveness also is extremely culturally relative - something that may be visually intuitive in one culture, for example, may not be in another; because of everything from language layout, to the role of color, and even the way different cultures process the passing of time.

If we are to empower users to accomplish complex tasks through software, the interface itself may have to be complex. That is not to say that the interface has to be difficult to use! Complex interfaces should, instead, guide the user to an understanding of their capabilities and operation while still keeping them in a flow state. Regardless of how complex the interface is, or the point in the path when the user is learning to use it, they should still be actively engaged in the process, and not become discouraged or feel overwhelmed by the complexity. Interfaces should not shy away from complexity, but should instead guide and assist the user in understanding the complexity.

Why does software not support learning how to use the software inside the software itself?

Why don’t we allow software to teach its users how to use it, without having to rely on these external sources? What would allow for this change to occur?

🐦 @nickarner

📝 Some Thoughts on Interfaces

New Kind of Paper

This new kind of paper understands what you are writing and try to be smart about what you want.

Are there any programming languages that were designed for pen and paper? Yes, there was. A Programming Language, also known as APL. A language that started as a notation that was designed for human-to-human communication of computer programs, usualy written with pen on a paper, or chalk on a blackboard. To be fair, even APL suffered the transition from blackboard to keyboard. Original notation had sub-/superscripts and flow of the program was depicted with lines. When APL became a programming language, it was linearized, lost its flowchart-like visual, but kept its exotic glyphs.

So, if we throw out boxes-and-arrows, i.e. visual programming stuff, what's left? What is the essence of what we are trying do here? Is there a place for a more symbolic, but visually-enriched approach?

Mathematical ideas are conventionally expressed using notation and terminology developed using static media. Suppose, however, that mathematics had been invented after modern computers. This is perhaps difficult to imagine – after all, mathematics helped lead to computers – but let's do the thought experiment anyway. Might mathematical notation have developed in a different way? Would we instead have developed a dynamic, interactive notation more powerful than the static mathematical and linguistic notations in common use today?

🌐 Milan Lajtoš

📝 New Kind of Paper Part 1

📝 New Kind of Paper Part 2

📝 New Kind of Paper Part 3

BI is dead

How an integration between Looker and Tableau fundamentally alters the data landscape.

This could be the beginning of the bifurcation of traditional BI into two worlds: One for data governance and modeling applications, and one for the visualization and analytics applications.”

“If you split Looker into LookML and a visualization tool, which one would be BI?” Or, in the terms of this integration, if you have both Looker and Tableau, which one is your BI tool?

My blunt answer is Tableau. You answer your questions in Tableau; BI tools are, above all, where questions get answered.

In this world, the cloud service providers become the major combatants in the market for data infrastructure, while data consumption products designed for end-users and sold on a per-seat basis—including exploration tools, a reconstituted BI, and data apps—are built by the rest of the ecosystem.

🐦 Benn Stancil

📝 BI is dead

Market Research at Bell Labs: Picture Phone vs Mobile Phone

During its long existence Bell Labs developed many revolutionary technologies, two of them were the Picture Phone and the Mobile Phone, both had market research studies commissioned with varying levels of accuracy at predicting the actual success of the product.

Picturephone Product Photo

About the Picturephone

AT&T executives had in fact decided to use the fair as an opportunity to quietly commission a market research study. That the fairgoers who visited the Bell System pavilion might not represent a cross section of society was recognized as a shortcoming of the survey results.

...

Users complained about the buttons and the size of the picture unit; a few found it difficult to stay on camera. But a majority said they perceived a need for Picturephones in their business, and a near majority said they perceived a need for Picturephones in their homes.

...

When the AT&T market researchers asked Picturephone users whether it was important to see the person they were speaking to during a conversation, a vast majority said it was either "very important" or "important".

...

Apparently the market researchers never asked users their opinion whether it was important, or even pleasurable, that the person they were speaking with could see them, too.

—The Idea Factory. Page 230-231

Picturephone Use Case Sketch

About the Mobile Phone

A marketing study commissioned by AT&T in the fall of 1971 informed its team that "there was no market for mobile phones at any price."

...

Though Engel didn't perceive it at the time, he later came to believe that marketing studies could only tell you something about the demand for products that actually exist. Cellular phones were a product that people had to imagine might exist.

—The Idea Factory. Page 289

Similar yet Different

But anyone worrying that the cellular project might face the same disastrous fate as the Picturephone might see that it had one advantage. A Picturephone was only valuable if everyone else had a Picturephone. But cellular users didn't only talk to other cellular users. They could talk to anyone in the national or global network. The only difference was that they could move.

—The Idea Factory. Page 289

Resources

📚 Instadeq Reading List September 2021

Here is a list of content we found interesting this month.

Liveness

To build the last-mile of corporate technology, to usher in a new era of computing literacy, and to generally indulge the insatiable appetite of world-munching software, we need live apps that, like spreadsheets, are not treated as finished products, but as building blocks to be extended in real time using low-code techniques.

Live apps are not finished products. They can be extended in real time using low-code techniques that blur the line between user and developer.

🐦 Michael Gummelt

🔗 vision.plato.io

Is BI Dead?

Over the last decade, many of these early BI functions have been stripped out of BI and relaunched as independent products.

Just as the cloud rewrote our expectations of what software is and what it isn’t, the modern data stack is slowly rewriting our expectations of BI.

BI tools should aspire to do one thing, and do it completely: They should be the universal tool for people to consume and make sense of data. If you—an analyst, an executive, or any person in between—have a question about data, your BI tool should have the answer.

The boundary between BI and analytical research is an artificial one. People don’t sit cleanly on one side or the other, but exist along a spectrum (should a PM, for example, use a self-serve tool or a SQL-based one?). Similarly, analytical assets aren’t just dashboards or research reports; they’re tables, drag-and-drop visualizations, narrative documents, decks, complex dashboards, Python forecasts, interactive apps, and novel and uncategorizable combinations of all of the above.

A better, more universal BI tool would combine both ad hoc and self-serve workflows, making it easy to hop between different modes of consumption. Deep analysis could be promoted to a dashboard.

Marrying BI with the tools used by analysts brings everyone together in a single place. A lot of today’s analytical work isn’t actually that collaborative.

🐦 Benn Stancil

🔗 Is BI dead?

What is analytics engineering?

Analytics engineers provide clean data sets to end users, modeling data in a way that empowers end users to answer their own questions.

While a data analyst spends their time analyzing data, an analytics engineer spends their time transforming, testing, deploying, and documenting data. Analytics engineers apply software engineering best practices like version control and continuous integration to the analytics code base.

Today, if you’re a “modern data team” your first data hire will be someone who ends up owning the entire data stack.

On the surface, you can often spot an analytics engineer by the set of technologies they are using (dbt, Snowflake/BigQuery/Redshift, Stitch/Fivetran). But deeper down, you’ll notice they are fascinated by solving a different class of problems than the other members of the data team. Analytics engineers care about problems like:

  • Is it possible to build a single table that allows us to answer this entire set of business questions?

  • What is clearest possible naming convention for tables in our warehouse?

  • What if I could be notified of a problem in the data before a business user finds a broken chart in Looker?

  • What do analysts or other business users need to understand about this table to be able to quickly use it?

  • How can I improve the quality of my data as its produced, rather than cleaning it downstream?

The analytics engineer curates the catalog so that the researchers can do their work more effectively.

🐦 dbt

🔗 What is analytics engineering?

Is the modern analytics stack unbundling, or consolidating?

Despite a recent proliferation of tools in the modern data stack, it’s unclear whether we’re seeing an unbundling of data tooling into many separate layers, or the first steps towards consolidation of data tools.

One popular interpretation of this explosion of data tools is that we are witnessing the “unbundling” of the data stack. Under this interpretation, classically monolithic data tools like data warehouses are being dismantled into constituent parts.

However, it’s also possible that this “unbundling” represents a temporary state of affairs. Specifically, under this alternative thesis – which we’ll call “consolidation” – the proliferation of data tools today reflects what will ultimately become a standard set of features within just a few discrete, consolidated layers of the data stack.

If consolidation is so beneficial to users, why are we seeing “unbundling” now? My thesis is that this unbundling is a response to the rapidly-evolving demands on and capabilities of cloud data.

In a nutshell, the data ecosystem is slowly rebuilding the warehouse and analysis layers to adapt to the new reality of cloud data.

In the next two years, I expect we’ll see more attempts to consolidate the modern data stack, albeit in intermediate stages – for example, the consolidation of data pipelines and transformation, data catalogs with metrics layers, and dashboards with diagnostics.

Much of the work – especially in the analysis layer – is spread across an absurd number of tools today – not just business intelligence, but also spreadsheets, docs, and slides. Consolidating this work has the potential to transform the future of work for every modern organization, and to redefine the future of data.

🐦 Peter Bailis

🔗 Is the modern analytics stack unbundling, or consolidating?

Computer Science: A Discipline Misnamed (Fred Brooks)

I've been having conversations lately about topics related to the one in the title and somehow I got to an article titled The Computer Scientist as Toolsmith II (1994) by Fred Brooks (thanks to whoever recommended it, I wish we had better document/navigation provenance in our tools :)

Here's a summary, from now on it's all quotes from the article, emphasis mine (I wish we had Transclusion in our tools :).

I recommend you to read the whole article if you find the quotes below interesting.

A Discipline Misnamed

When our discipline was newborn, there was the usual perplexity as to its proper name.

We at Chapel Hill, following, I believe, Allen Newell and Herb Simon, settled on “computer science” as our department’s name.

Now, with the benefit of three decades’ hindsight, I believe that to have been a mistake.

If we understand why, we will better understand our craft.

What is a Science?

A science is concerned with the discovery of facts and laws.

Perhaps the most pertinent distinction is that between scientific and engineering disciplines.

Distinction lies not so much in the activities of the practitioners as in their purposes.

The scientist builds in order to study; the engineer studies in order to build.

What is our Discipline?

I submit that by any reasonable criterion the discipline we call “computer science” is in fact not a science but a synthetic, an engineering, discipline. We are concerned with making things, be they computers, algorithms, or software systems.

Unlike other engineering disciplines, much of our product is intangible: algorithms, programs, software systems.

Heinz Zemanek has aptly defined computer science as "the engineering of abstract objects".

In a word, the computer scientist is a toolsmith—no more, but no less. It is an honorable calling.

A toolmaker succeeds as, and only as, the users of his tool succeed with his aid.

How can a Name Mislead Us?

If our discipline has been misnamed, so what? Surely computer science is a harmless conceit. What’s in a name? Much. Our self-misnaming hastens various unhappy trends.

First, it implies that we accept a perceived pecking order that respects natural scientists highly and engineers less so, and that we seek to appropriate the higher station for ourselves.

We shall be respected for our accomplishments, not our titles.

Second, sciences legitimately take the discovery of facts and laws as a proper end in itself. A new fact, a new law is an accomplishment, worthy of publication. If we confuse ourselves with scientists, we come to take the invention (and publication) of endless varieties of computers, algorithms, and languages as a proper end. But in design, in contrast with science, novelty in itself has no merit.

If we recognize our artifacts as tools, we test them by their usefulness and their costs, not their novelty.

Third, we tend to forget our users and their real problems, climbing into our ivory towers to dissect tractable abstractions of those problems, abstractions that may have left behind the essence of the real problem.

We talk to each other and write for each other in ever more esoteric vocabularies, until our journals become inaccessible even to our society members.

Fourth, as we honor the more mathematical, abstract, and “scientific” parts of our subject more, and the practical parts less, we misdirect young and brilliant minds away from a body of challenging and important problems that are our peculiar domain, depriving these problems of the powerful attacks they deserve.

Our Namers got the “Computer” Part Exactly Right

The computer enables software to handle a world of complexity not previously accessible to those limited to hand techniques. It is this new world of complexity that is our peculiar domain.

Mathematicians are scandalized by the complexity— they like problems which can be simply formulated and readily abstracted.

Physicists or biologists, on the other hand, are scandalized by the arbitrariness. Complexity is no stranger to them. The deeper the physicists dig, the more subtle and complex the structure of the “elementary” particles they find.

But they keep digging, in full faith that the natural world is not arbitrary, that there is a unified and consistent underlying law if they can but find it.

No such assurance comforts the computer scientist.

The Toolsmith as Collaborator

If the computer scientist is a toolsmith, and if our delight is to fashion power tools and amplifiers for minds, we must partner with those who will use our tools, those whose intelligences we hope to amplify.

The Driving-Problem Approach

Hitching our research to someone else’s driving problems, and solving those problems on the owners’ terms, leads us to richer computer science research.

How can working on the problems of another discipline, for the purpose of enhancing a collaborator, help me as a computer scientist? In many ways:

  • It aims us at relevant problems, not just exercises or toy-scale problems.

  • It keeps us honest about success and failure, so that we don’t fool ourselves so easily.

  • It makes us face the whole problem, not just the easy or mathematical parts. We can’t assume away ill-conditioned cases.

  • Facing the whole problem in turn forces us to learn or develop new computer science, often in areas we otherwise never would have addressed.

  • Besides all of that, it is just plain fun to look over the shoulders of those discovering how proteins work, or designing submarines, or fabricating on the nanometer scale.

Two of our criteria for success in a tool are:

  • It must be so easy to use that a full professor can use it, and

  • It must be so productive that full professors will use it.

Our Journey to a Low-Code Data Lake

Overview

Since November 2014 we have been implementing a platform to collect, store, process, analyse and visualize logs using big data and streaming technologies. The main objective is to detect important events, generate statistics and produce alerts to solve problems in a proactive way.

Application servers (such as Glassfish, SunOne or Weblogic), HTTP Servers (Apache HTTP Server), Databases, Web Applications, Batch Processes, Java Applications, Windows and Linux Servers and related technologies are constantly generating logs with errors, warnings, incidents, accesses, audit logs, executed commands and all kinds of information about their running processes.

Our first pilot on a new customer is usually about application logs but it is a "Trojan Horse". Once this platform is up and running it naturally becomes the centralized repository not only for logs but also for any type of sources and data formats. With dashboards on display in big screens other areas and departments start requesting dashboards of their own.

But this is only the beginning of a long road for us and our customers. To adapt to different use cases and new requirements we needed a more modular, flexible and extensible architecture.

As the Data Lake gained prominence within the Ministry of Social Security during 2015 and other project opportunities materialized, challenges and constraints emerged that led us to rethink our initial architecture.

The constraints came in two basic flavors: technical and business. Throughout 2016 we dedicated our spare time to study and evaluate tools to make the leap in quality that we needed. In the next sections we are going to focus on the business constraints and why StreamSets and Instadeq, our Low-Code/No-Code stack, were the answer to them.

Old Architecture [2015-2016]

/galleries/post-images/our-journey-to-a-lowcode-data-lake/old-architecture.png

Challenges

Technical issues are not the only constraints in software architecture design. Even when they are the most important, business restrictions are highly influential too:

  1. Data democratization

    We were struggling to keep up with all the data reports and visualizations. We needed a way to allow non-specialists to have the ability to gather and analyze data without requiring help from our team.

  2. Data visualisation and data-driven decision making

    We were part of meetings where people were making decisions based on intuition or using reports outdated by days, weeks or even months. We needed a platform to allow non-specialists to make ad-hoc reports on easily accessible, accurate and up to date data.

  3. Skill gap between ideal position requirements and market availability

    It was really hard for our local partners to find qualified employees to work in our area. The solution at hand was to hire junior engineers right after their graduation to help in active projects. This increased our need for easy to use tools that allowed new employees to be productive from day one.

  4. Public procurement cycle

    The way projects are structured in the public sector makes it common for us to do 3 to 6 month projects to solve particular problems and then have to wait for months until the next stage is approved for us to go back. The gaps in our presence require the end user to be able to inspect, troubleshoot and make small modifications to running systems without requiring deep technical skills. Our integration and visualization tools should make it easy for them to create new dashboards or modify existing ones.

  5. Reduce manual work on deployment process

    We relied on scripts to automate most tasks but we needed a platform to minimize the manual work. We required a tool to centralize the creation, validation, testing, building and deployment of pipelines in order to eliminate the intermediate steps between our workstations and the integrations running on production.

  6. Data Integration and data visualization as a new commodity

    When we started in 2014, having a centralized Data Lake where our customers could make ad-hoc queries, live dashboards and mapreduce jobs was enough to win projects. After a few months that became a commodity, a starting point.

    Most dashboards, including the data integrations were required to be live the next morning. We were working in environments with one urgency after another. We needed tools to create new integrations and consume, parse, store and visualize data as soon as possible.

  7. Monitor data integration pipelines and troubleshoot with clarity

    Both in development as in production we needed tools that allowed anyone to find the cause of issues as quickly and as easily as possible, this activity is easier to achieve if live data is available for inspection. We had tools that were efficient and performant but when there was a problem it was really hard to find out the cause. Rebuilding and redeploying jobs in multiple nodes made the process slow and tedious.

  8. Live and interactive demos

    We started giving many presentations and pre-sales talks. Our audience wanted to see live demos of real projects. We needed something more attractive than config files, bash scripts and a lot of JSON.

  9. Flexible architecture

    Our local partners were looking for partnerships in the Big Data space, this required us to prioritize some vendors over others. Also some of our customers already had licenses for specific products. We needed an architecture that was flexible enough to replace one component for another without changing the solution's nature.

  10. Fast analytics on fast data

    Evolving expectations from our customers called for a more powerful data storage engine. It needed to be fast for inserts but also fast for updates and ad-hoc queries and analytics.

Solution: A Low-Code Architecture

StreamSets Data Collector and Instadeq, our Low-Code/No-Code stack, gave us the leap in quality we needed and responded to many of the challenges we had. Both backed by very solid tools like Kafka, Solr, Hive, HDFS and Kudu. In January 2017 we had our new architecture installed and running in production.

With StreamSets and Instadeq our time to production was shortened by days, thanks to their user-friendly UI, visual approach and drag-and-drop capabilities.

These tools have prebuilt and reusable components to empower non-technical business users to build end-to-end data transformations and visualizations without the need to write a single line of code. The inclusion of non-technical users in the data lake construction process eliminated the need to hire expensive, specialized developers and promoted data democratization and data driven decisions.

These intuitive tools solved our problem with the public procurement cycle. Now the end user was able to inspect, troubleshoot and make small modifications to running pipelines and dashboards.

Unlike other low-code tools with rigid templates that limit what you can build and customization is restricted, StreamSets and Instadeq have components that allow you to go low level and even extend the platform.

Current Architecture [2017-2021]:

/galleries/post-images/our-journey-to-a-lowcode-data-lake/current-architecture.png

Why StreamSets?

/galleries/post-images/our-journey-to-a-lowcode-data-lake/streamsets.png

The selection process for the ingestion and transformation component in our architecture took the longest time.

We have a deep belief that in order to make a long-term commitment to a tool it is very important to trust not only the latest version of the product but also the team and company behind it.

Since we started with Big Data in November 2014 until we built the new architecture in January 2017, we analyzed and tested multiple tools both in development and production and it was StreamSets that excelled above all of them and continues to do so to this day.

As a product development company we have experience inferring if a product aligns with our vision of what a Big Data solution should be. We have a series of defined steps when analyzing any product:

  1. Implement a real use case end-to-end to validate features but also to experience as an end user

  2. Analyze the development team checking their public code repositories, the clarity of the commit logs, number of collaborators and level of activity

  3. Issue tracker responses

  4. Release notes to have an idea of the product’s evolution

  5. How easy it is to extend, build, test, deploy and integrate

  6. Community commitment, reviews, blogs, forums and responses in stackoverflow

  7. Vision from founders and investors

The feedback we received from the Big Data team confirmed that it was the right choice for data ingestion. We have a flexible architecture that allows interchangeability of components and it is the team that pushes to use StreamSets when there are other alternatives to consider. They are happy to work with a tool that gives them solutions without struggling with it.

The main highlights from our team when comparing it to other tools:

  • Quick and easy troubleshooting during development and in production

  • Detailed logging shows what’s happening

  • Snapshots and previews

  • Handles increasing data volume and number of pipelines with ease

  • Fast data drift adaptation

  • Supports structured and non-structured data

  • Variety of sources, processors, sinks and formats and ease of extension when some component is not available

  • No downtimes for maintenance thanks to pipeline replication

  • Early warnings, threshold rules and alarms

  • Detailed metrics and observability

  • Great integration with the rest of the architecture components such as Kafka, HDFS, Solr and Instadeq

The last big surprise we had was how StreamSets improved our pre-sale presentations. Being a clear and visual tool, it allowed us to make demos where managers could understand what they were going to find at the end of the project. StreamSets and Instadeq allowed us to have functional, clear and highly visual demos. Something that’s not possible with other ETL tools or frameworks like Spark and Flink.

With our continuous and expanding use of StreamSets as our data integration component we started formalizing some emerging patterns to:

  • Simplify maintenance

  • Avoid downtimes

  • Take advantage of Kafka, HAproxy and pipeline replication to scale integrations with large data volumes or complex transformations

Our StreamSets Data Integration Patterns post contains a list of our most used patterns.

Success Stories

We had great success with this platform with our first customer in 2015 and this lead us to get new prospects mainly in Government Agencies. Our list of implementations and pilots includes:

  • Ministry of Employment and Social Security

    Logs centralization and fraud detection jobs around social security pensions and other social programmes. Acknowledgments and articles in technology magazines:

  • Ministry of Health

    Part of the Data Lake and Instadeq Dashboards were used by the Covid Task Force to support the decision making process and to monitor covid cases, the Vaccination Programme and EU Digital COVID Certificate Processes.

    We also provided internal tools built with Instadeq to support Vaccination Centers and doctors accesing information about patients, vaccines and certificates.

  • Central Bank

    Aggregation and visualization of logs from Windows Servers, Event Tracing for Windows (ETW), Internet Information Server (IIS) and .NET applications.

  • Ministry of Education

    Fraud detection jobs on Sick Leaves and school resources management.

  • Telecommunications Services Company

    Monitorization and incident response for their Data Center consuming signals from routers, switches and Uninterruptible Power Supply (UPS).

  • One of the largest media and retail companies in the country

    The pilot mainly focused on implementing Machine Learning on infrastructure logs on Supermarket’s Christmas marketing campaigns.

The Future

Now that data integration and visualization is a commodity for our customers thanks to StreamSets, Kafka and Instadeq, our new challenges are to dive deeper with stream processing, security, data governance and machine learning.

We have already implemented a few machine learning cases with Tensorflow, Pandas and Scikit-learn using Docker containers and Jupyter notebooks for development.

We are studying tools for Machine Learning lifecycle management such as Kubeflow, mlflow and Seldon. We have recently implemented Apache Atlas for metadata management and governance capabilities and Apache Ranger for security administration, fine grained authorization and auditing user access.

Upcoming Projects:

  • Inmigration and Border Services: Use cases still under analysis to process live data on the main country airport.

  • Revenue Agency / Taxation Authority: The firsts use cases include processing terabytes of database query audit logs and middleware logs using Oracle Golden Gate to stream them to Kafka. The project also includes the monitorization of infrastructure and Java application logs.

New Architecture Under Study [2021-]

/galleries/post-images/our-journey-to-a-lowcode-data-lake/future-architecture.png

Our StreamSets Data Integration Patterns

With our continuous and expanding use of StreamSets as our data integration component we started formalizing some emerging patterns that allowed us to:

  • Simplify maintenance

  • Avoid downtimes

  • Take advantage of the use of Kafka, HAproxy and pipeline replication to scale integrations with large data volumes or complex transformations

What follows is a list of some of our most used patterns.

Logical High-Level Data Integration Pattern

As a general rule, we divide each integration into 3 stages that can contain 3 or more pipelines.

/galleries/post-images/our-streamsets-data-integration-patterns/integration-standard.png

The advantages for this approach are:

  • Stages isolation allows process changes at a specific stage without affecting the others.

  • Kafka in the middle assures that if a parser or store is down, data continues to be consumed and stored in Kafka for 7 days.

  • Kafka also allows parallel processing with replicated pipelines.

  • The parsed logs pushed to Kafka can be accessed immediately by other tools such as Flink Streaming, KSQL or Machine Learning containers without replicating the rules applied in the Streamsets pipelines.

  • We can have pipelines running and consuming logs in computers outside our cluster and pushing the data to Kafka. Later the parsing and storage is centralized in the cluster.

Stage 1 - Consumer Pipeline

A StreamSets pipeline consumes raw data and pushes it into a Kafka Topic with the name projectname.raw.integration. For example projectx.raw.weblogic

  • This allows us to modify, stop and restart the Parse and Store pipelines without losing the data generated during maintenance windows

  • This pipeline is not needed for agents that write directly to kafka

  • For some specific cases, the same pipeline or another one writes the data to HDFS or external storage that needs the raw data. Mainly sources required for audits.

/galleries/post-images/our-streamsets-data-integration-patterns/1-consumer.png

Stage 2 - Parse & Enrichment Pipeline

A second pipeline consumes the raw data from the raw topic, parses and enriches the log and stores the new data in a new topic: projectname.parsed.integration

The most common transformations are:

  • Parse log pattern using Log Parser.

  • Remove unnecessary fields with Field Remover.

  • Rename or change a field's case using Field Renamer.

  • Generate new fields using Expression Evaluators.

  • Enrichment using Redis Lookup or Apache Solr as key value stores. For example:

    • Add an environment field (prod, stage, qa, dev) using the hostname as key

    • Add company details using their tax identification number

    • IP geolocation lookup

  • Convert date to UTC or string to numbers using Field Type Converter.

  • Discard records or route them to different Kafka topics using Stream Selector.

  • Flatten fields with Field Flattener.

  • Some complex business rules written in Jython.

  • Generate fields year, month, day for partitioning in Kudu.

  • Generate Globally Unique Identifier (GUID / UUID).

  • Parse date fields.

The following is our “2 - Apache Access - Parser” pipeline:

/galleries/post-images/our-streamsets-data-integration-patterns/apache-log-parser.png

Steps:

1. Consumes logs from the "raw" topic
2. Converts HTTP body to Json
3. Pivot Body fields to the root of the Record
4. Route apache error and apache access to different paths

   1.1. Parse apache error
   1.2. Add Kafka destination: parsed.apache_error topic

   2.1. Parse apache access
   2.2. Add Kafka destination: parsed.apache_access topic

5. Flatten fields
6. Remove headers and parsed names
7. Remove fields with raw data
8. Clean host names (lowercase and remove domain)
9. Solve environment using Redis
10. Add an ID field with an UUID
11. Convert dates to ISO
12. Convert timestamp fields to Long
13. Convert timestamps to milliseconds
14. Resolve apache access refererer
15. For apache access logs, use the IP address to identify geolocation
    using Apache Solr
16. Write the log to project_name.parsed.apache_access
    or project_name.parsed.apache_error

Stage 3 - Storage & Visualization Pipelines

The third pipeline consumes the parsed data from the topic and sends it to:

  • A Kudu table

  • HDFS folder

  • External storage (outside our cluster) such as Oracle databases

  • NAS storage for historical and backup such as EMC Isilon

  • Apache Solr

  • External Kafka Brokers (outside our cluster)

  • Instadeq for live dashboards and data exploration

Sometimes we use a single pipeline in StreamSets but if the destinations have different speeds or if one of them has more errors that provokes pipeline restarts, we use different pipelines for each destination.

We maintain the number 3 for all the pipelines because they all consume the logs from the parsed topics but send them to different destinations:

  • 3- Tomcat Access - Kudu Storage

  • 3- Tomcat Access - HDFS Storage

  • 3- Tomcat Access - Long-Term Isilon Storage

  • 3- Tomcat Access - Instadeq Dashboard

/galleries/post-images/our-streamsets-data-integration-patterns/3-store.png

Scaling Pipelines

When we have a pipeline with a high data volume, we scale it with:

For example in two customers we receive Tomcat access logs through HTTP posts and we have the following setup:

/galleries/post-images/our-streamsets-data-integration-patterns/lb-and-paralelism-flows.png

HAproxy Load Balancer

We create a new entry in our server running HAproxy: /etc/haproxy/haproxy.cfg

We receive HTTP Requests on port 4005 and forward them to 3 different “1- Tomcat Access - Consumer” StreamSets pipelines running in cluster-host-01, cluster-host-02 and cluster-host-03

frontend tomcat_access
bind 0.0.0.0:4005
mode http
stats enable
stats refresh 10s
stats hide-version
default_backend tomcat_access_servers

tomcat_access_servers
balance roundrobin
default-server maxconn 20
server sdc1 cluster-host-01:4005 check port 4005
server sdc2 cluster-host-02:4005 check port 4005
server sdc3 cluster-host-03:4005 check port 4005

Kafka: Topic Partitioning

We create projectx.raw.tomcat_access and projectx.parsed.tomcat_access Kafka topics with 3 or more partitions:

/bin/kafka-topics.sh --create \
        --zookeeper <hostname>:<port> \
        --topic projectx.raw.tomcat_access \
        --partitions 3 \
        --replication-factor <number-of-replicating-servers>

/bin/kafka-topics.sh --create \
        --zookeeper <hostname>:<port> \
        --topic projectx.parsed.tomcat_access \
        --partitions 3 \
        --replication-factor <number-of-replicating-servers>

Streamsets: Pipeline Replication

We replicate our pipeline to run in different cluster nodes, each one consuming from one of those partitions.

1- Tomcat Access - Consumer

  • Three pipeline instances running in three different nodes

  • Consume logs using a HTTP Server Origin listening on port 4005

  • Write the raw logs to Kafka using a Kafka Producer Destination

  • Target Kafka topic: projectx.raw.tomcat_access

2- Tomcat Access - Parser

  • Three pipeline instances running in three different nodes

  • Consume raw logs from Kafka using a Kafka Consumer Origin

  • Source topic: projectx.raw.tomcat_access

  • Parse, enrich and filter the logs

  • Write them to Kafka using a Kafka Producer Destination

  • Target topic: projectx.parsed.tomcat_access

3- Tomcat Access - Storage

  • Three pipeline instances running in three different nodes

  • Consume enriched Tomcat access logs from Kafka using a Kafka Consumer Origin

  • Source Kafka topic: projectx.parsed.tomcat_access

  • Store them in a Kudu table using a Kudu Destination.

  • Target Kudu table: projectx.tomcat_access

3- Tomcat Access - Instadeq Dashboard

  • A single pipeline instance

  • Consume enriched Tomcat Access logs from the three Kafka partitions using a Kafka Consumer Origin

  • Source Kafka Topic: projectx.parsed.tomcat_access

  • Send them to Instadeq using Instadeq webhooks

Examples

  1. Linux logs from RSysLog to a Kudu table using StreamSets for data ingestion and transformation

/galleries/post-images/our-streamsets-data-integration-patterns/linux-logs.png
  1. Java application logs sent to the cluster using log4j or logback, with StreamSets for data ingestion and transformation, KSQL for streaming analytics, Kudu for storage and Instadeq for live dashboards

/galleries/post-images/our-streamsets-data-integration-patterns/app-logs.png
  1. From Redmine to Instadeq Dashboard using Streamsets: Direct Integration without Kafka or any storage in the middle

/galleries/post-images/our-streamsets-data-integration-patterns/sdc-redmine-to-instadeq.png

📚 Instadeq Reading List August 2021

Here is a list of content we found interesting this month.

📑 A Brief History of Human Computer Interaction Technology by Brad Myers

Great list of HCI technologies by Brad A. Myers organized in categories, sorted by year and with references to all of them.

🐦 Brad Myers

🔗 Page: A Brief History of Human Computer Interaction Technology

🔗 ACM Walled Article: A brief history of human-computer interaction technology

Make sure to also check Brad A. Myers' Youtube Channel for great HCI Content

🎈 Design Principles Behind Smalltalk by Dan Ingalls

How many programming languages define themselves this way?

The purpose of the Smalltalk project is to provide computer support for the creative spirit in everyone. Our work flows from a vision that includes a creative individual and the best computing hardware available. We have chosen to concentrate on two principle areas of research: a language of description (programming language) that serves as an interface between the models in the human mind and those in computing hardware, and a language of interaction (user interface) that matches the human communication system to that of the computer.

Glamorous Toolkit vibes here:

Reactive Principle: Every component accessible to the user should be able to present itself in a meaningful way for observation and manipulation.

Interesting observation:

An operating system is a collection of things that don't fit into a language. There shouldn't be one.

🐦 Dan Ingalls

🔗 Design Principles Behind Smalltalk

🧑‍🎨 End-user computing by Adam Wiggins

Experts want choice; newbies want to be handed an integrated product where good choices have been made for them and they can dive straight into their task.

...

Too much focus on the technology (e.g., programming language) and too little focus on the user’s task.

...

Most laypeople don't care about computers; they care about what they can use a computer for

...

Most people will only care about computer programming when it offers them a clear way to accomplish specific goals that are relevant to their lives.

...

These tools all share the same two golden traits: no-fuss setup, and a programming language and development tools focused on the specific tasks their users want to achieve.

🐦 Adam Wiggins

🔗 End-user computing

📱 Collecting my thoughts about notation and user interfaces by Matt Webb

So Lynch’s five primitives comprise a notation.

It’s composable. A small number of simple elements can be combined, according to their own grammar, for more complex descriptions. There’s no cap on complexity; this isn’t paint by numbers. The city map can be infinitely large.

Compositions are shareable. And what’s more, they’re degradable: a partial map still functions as a map; one re-drawn from memory on a whiteboard still carries the gist. So shareable, and pragmatically shareable.

Not only are maps in this notation functional for communication, but it’s possible to look at a sketched city map and deconstruct it into its primitive elements (without knowing Lynch’s system) and see how to use those elements to extend or correct the map, or create a whole new one. So the notation is learnable.

🐦 Matt Webb

🔗 Collecting my thoughts about notation and user interfaces

🧰 Computers are so easy that we've forgotten how to create

Not all jobs will require coding, at least not yet. Rather, what we are going to need – as a society – is a certain amount of computational thinking in this increasingly technological world.

And in this way, computer programming is indeed the future. Programming can teach you a structured way of thinking, but it can also provide a way of recognising what is possible in the technological realm.

...

Why should we have to rely on a priestly class of experts who are the sole inheritors of a permission to play?

...

My dad never intended to sell his games; they were for our family alone. He was a computer user, but he was also a creator.

🔗 Get under the hood