🎥 Watch how to create interactive visualizations from SpaceX's JSON API: 🚀 SpaceX API Demo
Drag and drop fields or values to do operations that would require complex programming to achieve
Clone individual steps or complete projects, try alternatives, add dynamic filters and knobs to explore alternative scenarios
Create notebooks and dashboards once, results are updated automatically when new data is available
🎥 Watch how to create and share visualizations of Premier League Matches from a CSV: ⚽ Premier League Statistics
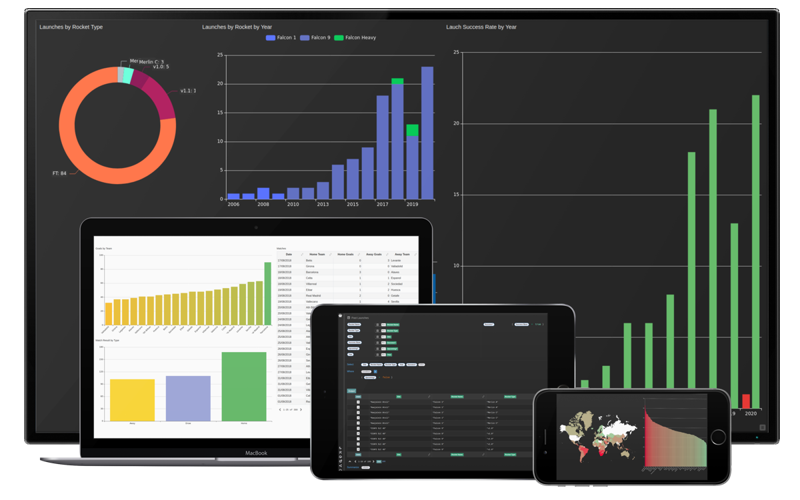
Reports adapt layout and content to the current device resolution
Nothing to install, just a modern web browser
Make a copy of a shared report to your workspace, modify it to your needs
When ready, share it again
Start from interactive templates and tutorials, remix shared notebooks and dashboards, clone your own or just starting from scratch
🎥 Watch how to create always up-to-date Sales visualizations from an Excel Spreadsheet: 📈 Sales KPIs from an Excel Spreadsheet
No modes, dialogs, complex navigation, extra screens or pop-ups
Notebooks and visualizations are live, reflecting every change instantly
Get recommended configurations and tips, go back to previous versions with time-traveling undo
🎥 Watch how to create live visualizations from Streams with PubNub: 💹 Trades Heatmap from PubNub Streams