
Interval Research Corporation: a 1990s PARC without a Xerox

/galleries/post-images/interval-research-corporation/IntervalResearchCorporation.png

Below are all organized and slightly edited quotes from the material listed in the Resources section.

Introduction

Founded in 1992 by Paul Allen, co-founder of Microsoft Corp., and David Liddle, a computer industry veteran with deep roots in research, Interval is a research setting seeking to define the issues, map out the concepts and create the technology that will be important in the future.

With its long-term resources, Interval pursues basic innovations in a number of early-stage technologies and seeks to foster industries around them -- sparking opportunity for entrepreneurs and highlighting a new approach to research.

Typical research areas at Interval include:

  • Signal computation

  • Digital entertainment systems

  • Field ethnography

  • Adaptive computational structures

  • Portable and wearable information technology

  • Interactive entertainment

  • Wireless communication and sensing

  • Network cultures

  • Design

  • Technology and lifestyle choices

  • Immersive environments

  • On-line journalism

  • Experimental media

To bring a fresh and real-world perspective to creating these futures, Interval has gathered a broad range of people to make up its research staff, including film makers, designers, musicians, cognitive psychologists, artists, computer scientists, journalists, entrepreneurs, engineers and software developers. The company also collaborates with other research groups and university laboratories, including the Royal College of Art, the MIT Media Lab, the Santa Fe Institute and Stanford University and many others.

Technology will change the way we perceive our world. Interval will change the way people feel about technology.

Name

The name Interval refers to the space between, or the interregnum, dividing the old order from the new world yet to be born - a process Allen and Liddle originally thought would take a decade. To bridge this interval, Allen planned to fund the lab for a decade. The years 1992 to 2002 were even printed on company name-tags.

People

With 116 scientists and 54 staff members, Interval is not the largest research laboratory in Silicon Valley, where both Xerox and IBM have a major presence. But Interval has always had a special buzz and a collection of talent that, even in the annals of technological genius, stands out.

There are great inventors from PARC, Atari, and Apple, and there are a host of younger researchers plucked from Stanford and the MIT Media Lab. These people are famous - at least in the Valley - for inventing or developing key aspects of the PC revolution.

History

Liddle joined PARC in 1972. Soon he was running the Systems Development Division, formed to sell the Star, Xerox's first commercial workstation. Xerox introduced the first GUI with icons, the desktop metaphor, dialog boxes, object-oriented programming, the laser printer, and the Ethernet LAN - all the great inventions that made Apple, Microsoft, Adobe, 3Com, and other competitors fabulously wealthy. Why Xerox let its technology walk out the door is a long story. Suffice it to say that, for Liddle, the experience left a lasting impression; at Interval, things would be done differently.

Joining forces in '91, Allen and Liddle began staffing Interval with an all-star team of Silicon Valley players. It was Liddle's inspiration to organize Interval's brainpower around projects, with everyone expected to work on two or three of them at once. Today, researchers are still scattered throughout the building randomly, and everyone is encouraged to work together. This is accomplished by dividing time into points and giving everyone 20 to spend. A project will be budgeted for so many points, and a project leader will recruit fellow researchers by signing up teammates for primary (14 points), secondary (6 points), or lesser (3 points) commitments.

"When Interval grew to over a hundred researchers, David took the seven gray-haired staffers and said, 'Ye shall be area chairs,'" adds Johnson, who is one of these chairs (although she is blond). Interval's seven fields of research, currently scattered throughout areas codenamed Alpha, Bravo, Charlie, and so on, included computer graphics and image processing, new computer design, signal processing, audio research and wearable computing, human-computer interaction, market research, and electronic assembly in Interval's shops.

Collaborations

To bring a fresh and real-world perspective to creating the future, Interval has gathered a broad range of people to make up its research staff, including film makers, designers, musicians, cognitive psychologists, artists, computer scientists, journalists, entrepreneurs, engineers and software developers.

Additionally, Interval collaborates on an ongoing basis with other research groups, university laboratories and new media publishers, including the following:

Workshops

The workshop's purpose is to encourage collaboration between different disciplines such as design, engineering, art, cognitive science, music, and communication in creating the products of the future. Interdisciplinary collaboration and teamwork is an essential ingredient in finding new design solutions, usable interfaces, and appealing products. Interval benefits by seeing alternative ideas about future directions for technology from students around the world.

Six to eight educational institutions receive the invitation to participate in the fall. Students work throughout the academic year on the "Design Challenge" which Interval proposes. Each participating institution selects one team to come to Palo Alto to take part in a week long workshop the following July in which students and faculty share their experiences and results.

1995 Design Challenge

Sound, music and speech are often overlooked as essential and related data types in the use of multimedia. The visual metaphor for design has been the dominant focus of past work, leaving the sonic features and elements behind in the development of interface solutions. With this in mind, we asked the design teams to design new prototype tools and interfaces for sound, music or speech access. We asked that they design with the idea that the future of multimedia needs will be sonic just as much as it is currently visual.

1996 Design Challenge: "Remote Play"

University Workshop projects in 1996 focused on ways in which people can play together using computer-mediated objects and interfaces. All the projects were about some form of "remote play." Students defined for themselves what "remote play" might mean; each project took a different, and delightful direction.

Projects

Studying People

Members of Interval's Research Staff spend much of their time "in the field" talking to and studying people at home, work and play.

  • Electric Carnival at Lollapalooza: The Electric Carnival offered concert goers a sampling of 60 digital exhibits from an array of the most innovative artists, software developers, and visionaries working with technology today.

  • Placeholder: a Virtual Reality project which explored a new paradigm for narrative action in virtual environments.

Studying Techniques

One of our goals at Interval is to change the way people feel about technology. To bring a fresh and real-world perspective to creating the future, Interval has gathered a broad range of people to make up its research staff, including filmmakers, clothes designers, musicians, cognitive psychologists, artists, computer scientists, journalists, entrepreneurs and software developers. Typical areas of research for Interval include Home Media, Remote Presence, Wearable Technology, Personal Appliances and Music.

  • SoundScapes: enabling non-musicians to interact/play music in both a rich visual and sonic form using a standard desktop computer system. As part of this exploration, we designed a series of computer 'instruments' to be played alone or together over multiple networked sites by both musicians and non-musicians.

  • Enterprise: an experiment in journalism, developing a prototype of a business magazine on CD-ROM.

  • Wearables: a workshop at the Royal College of Art in London. The A'WEAR studio brought students in the industrial design and computer-related design departments together with their counterparts in the fashion & textile department for an intensive, five-day exploration.

Studying Technology

With its long-term resources, Interval pursues basic innovations in a number of pre-competitive technologies and seeks to foster industries around them.

Some of the technology areas we focus upon include Signal Processing, Computation, Representation, Adaptation, Display and Networking.

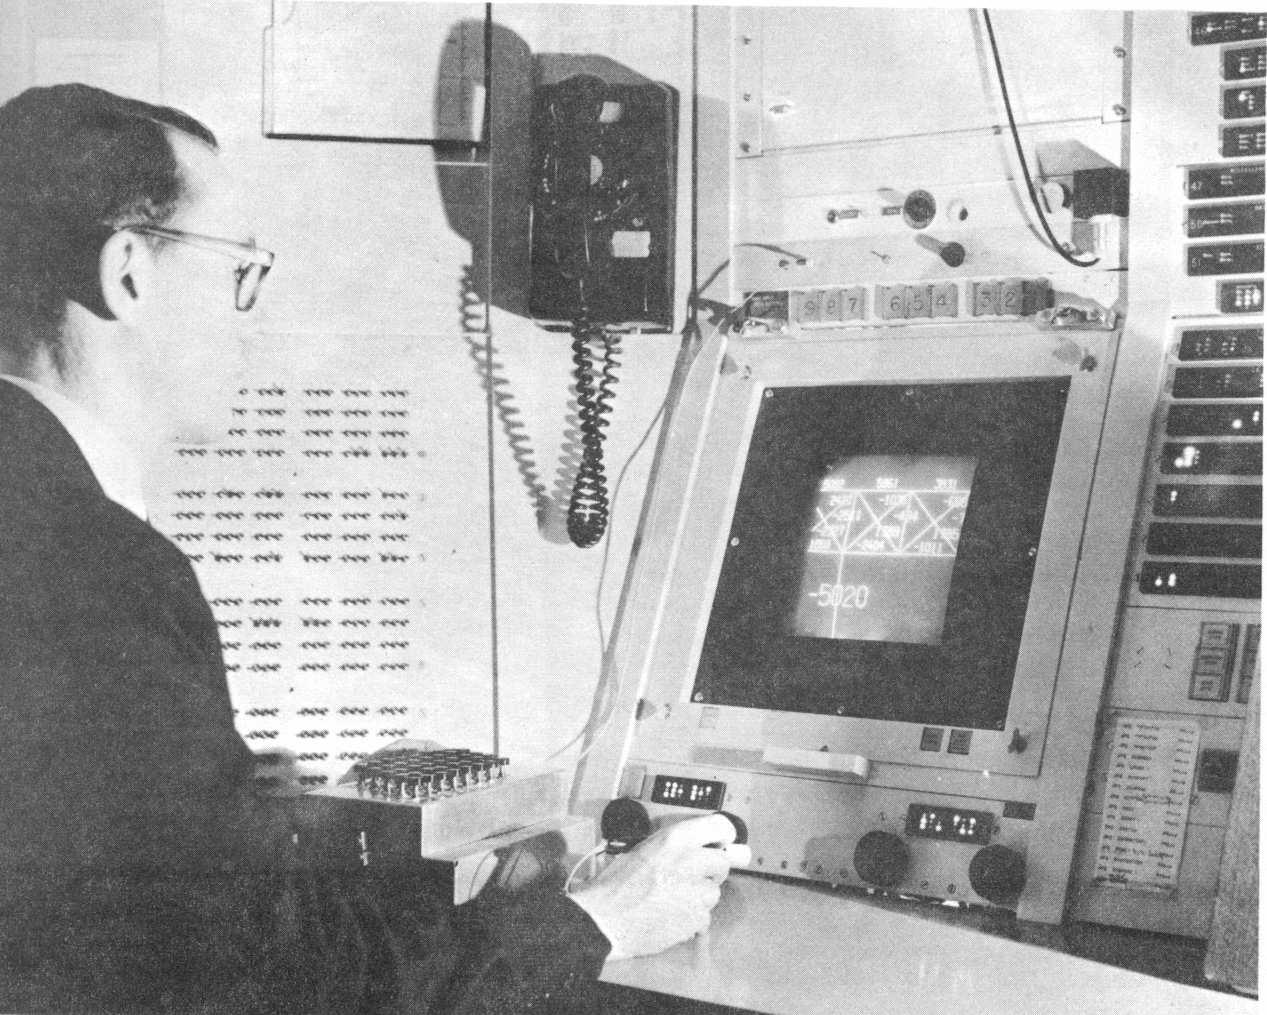
  • See Banff!: an interactive stereoscopic kinetoscope installation.

  • Be Now Here: an immersive virtual environment about landscape and public gathering places. It consists of a large 3D video projection, four-channel surround audio, a simple input device, and a 16-foot diameter rotating viewing platform on which the audience stands, which rotates once per minute in sync with the panoramic image and sound.

  • Rouen Revisited

  • Signal Computation: our homage to the hundredth anniversary of Monet's cathedral paintings. Like Monet's series, our installation is a constellation of impressions, a document of moments and percepts played out over space and time. In our homage, we extend the scope of Monet's study to where he could not go, bringing forth his object of fascination from a hundred feet in the air and across a hundred years of history.

Final Days

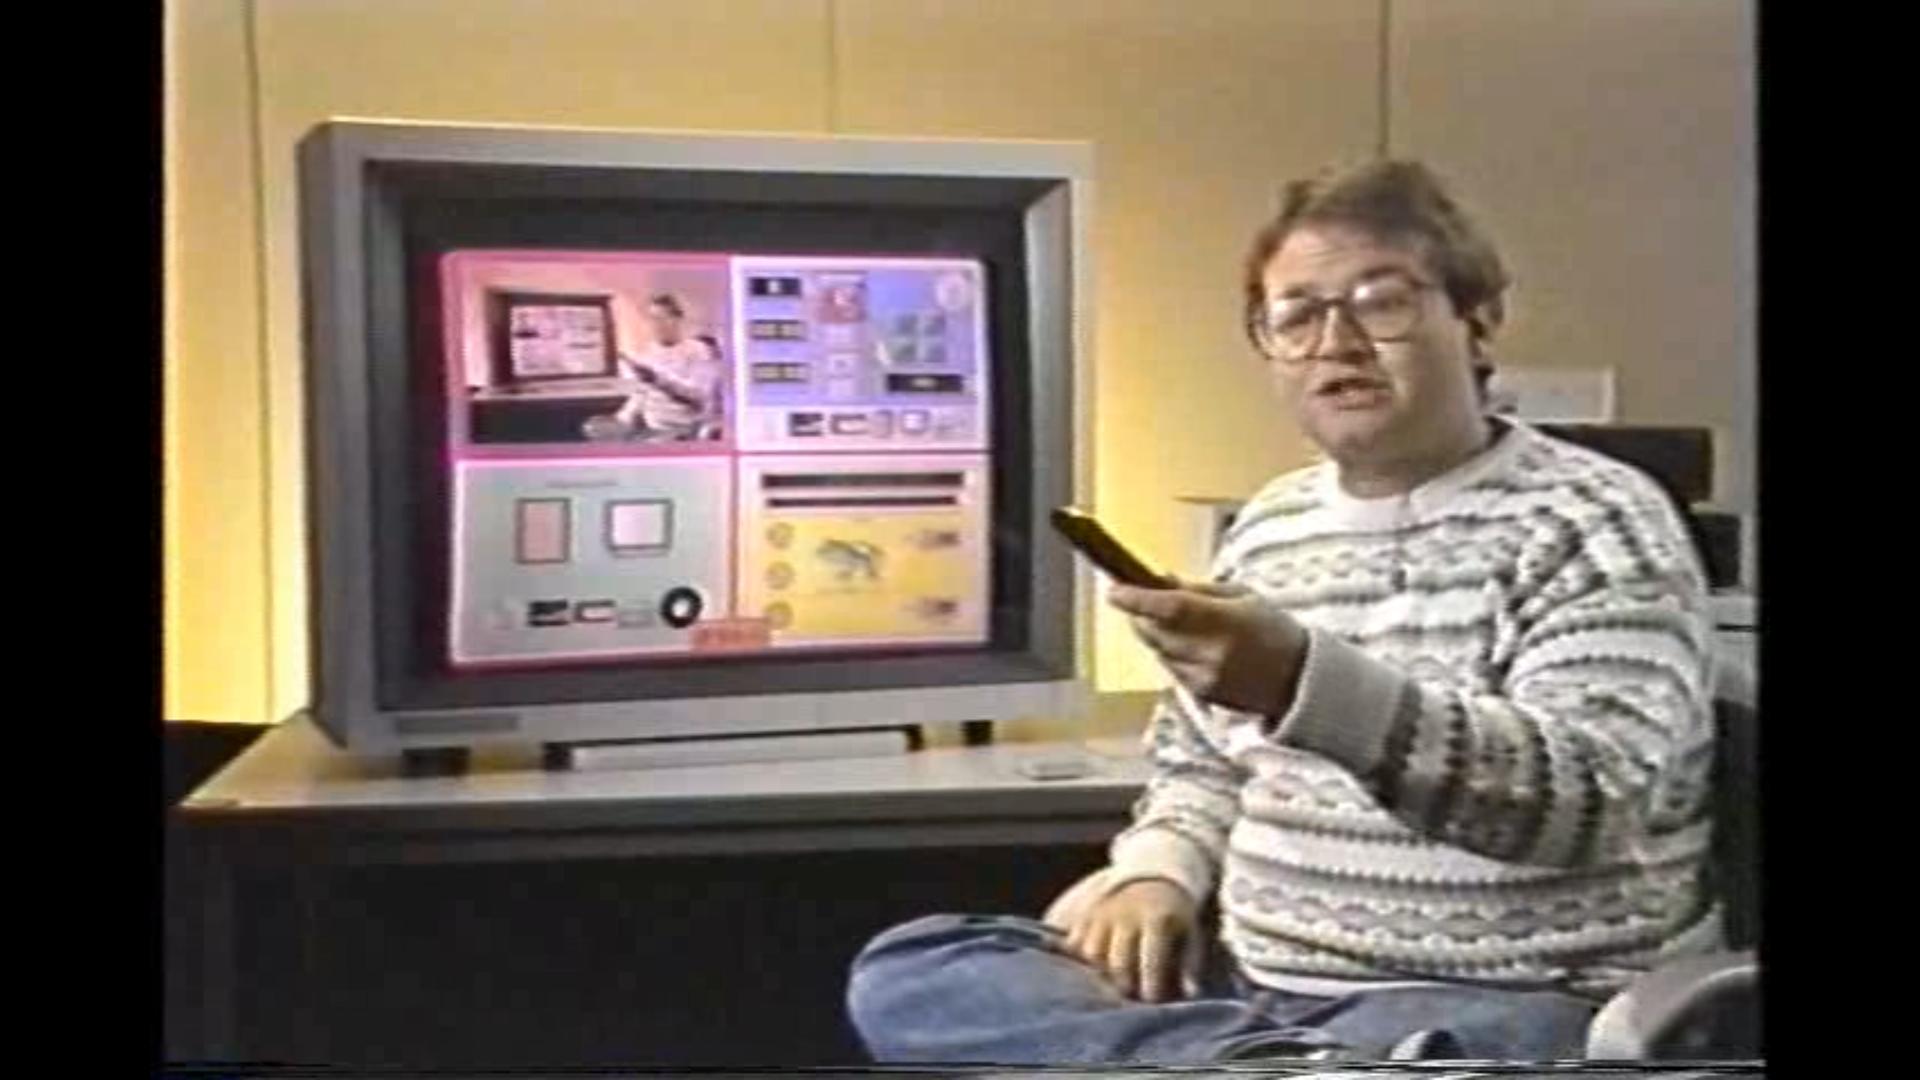
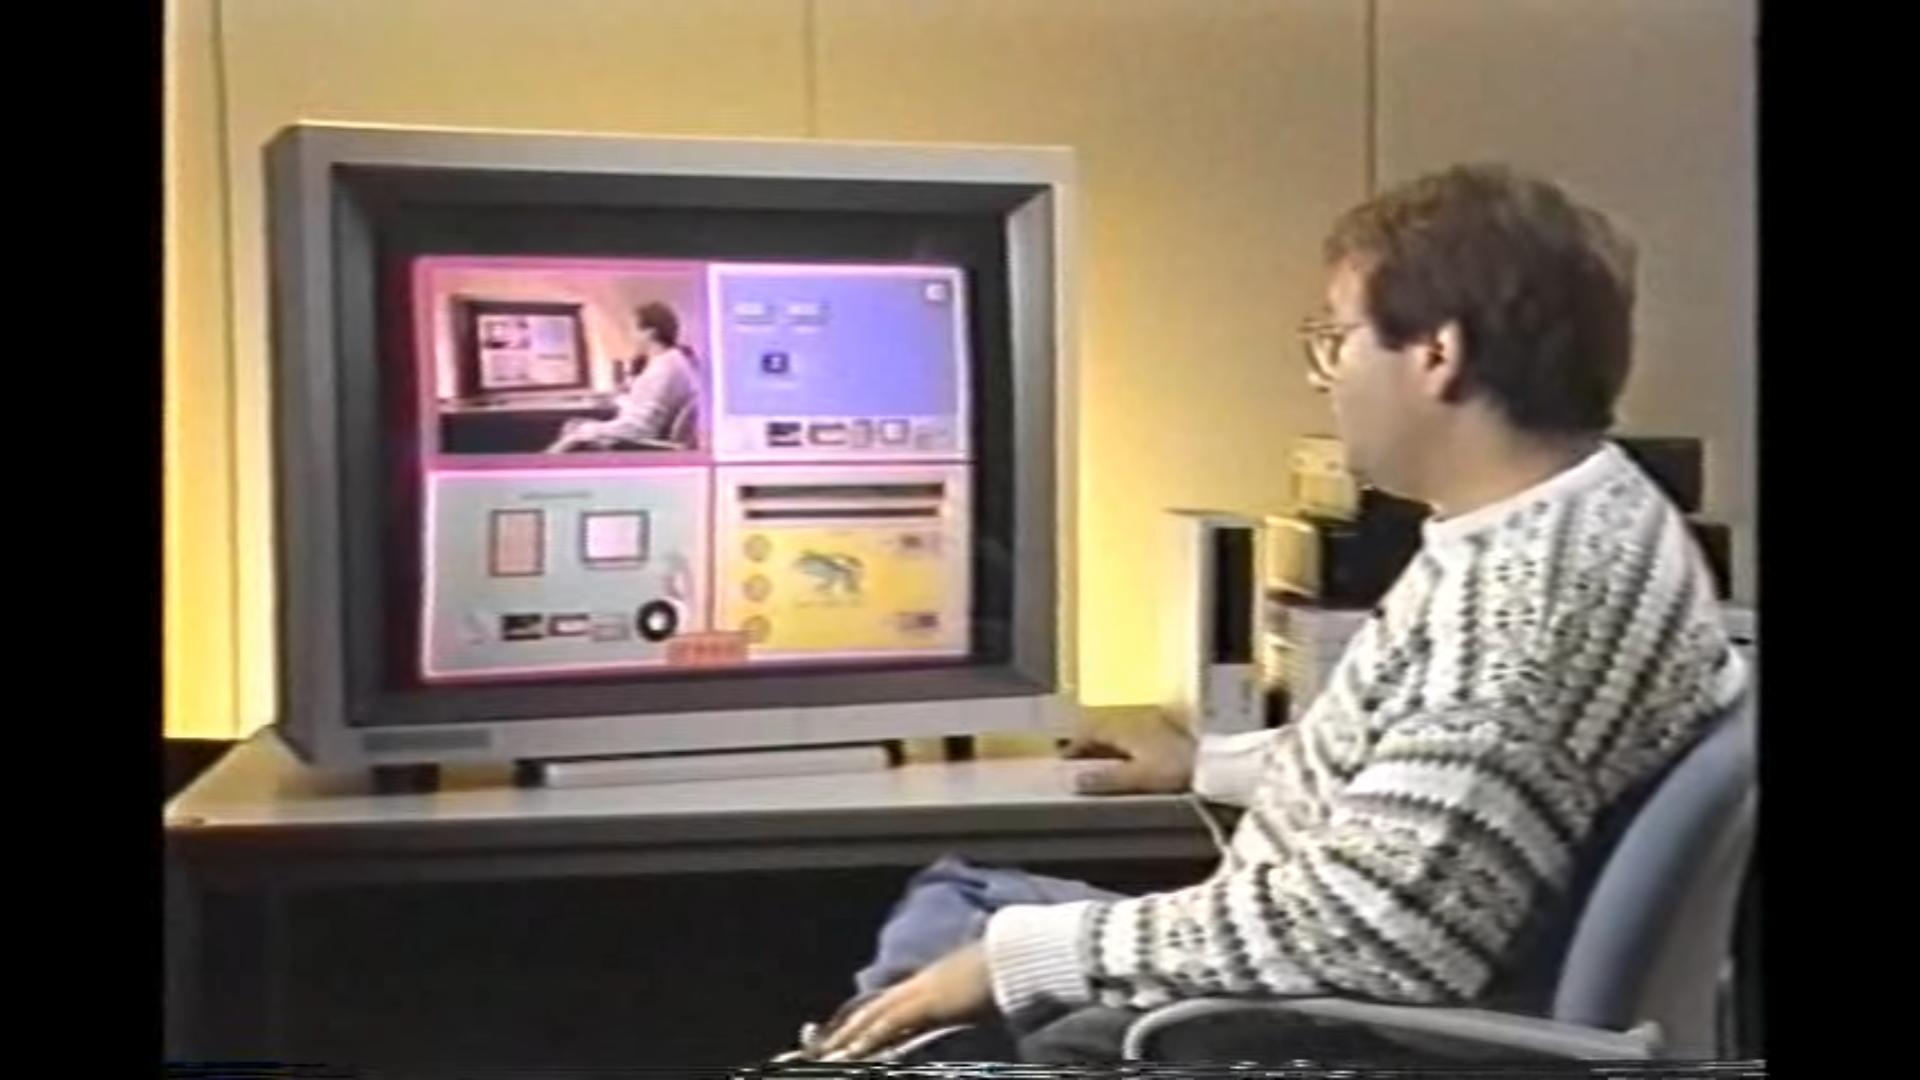
After seven years of blue-sky exploration, Interval Research Corporation - the Palo Alto, California, think tank financed by Microsoft cofounder Paul Allen - is coming in for a landing. Open-ended research in information technology is the only life it has ever known, but now the lab is leaving behind the thin air of advanced ideas to work on creating marketable products.

This shift in direction rocked the lab all the way to the top in mid-September, when David Liddle, Interval's founding director and CEO, stepped down.

In a three-sentence statement his press office released, Paul Allen acknowledged Interval's "shift in focus" from pure research to product development.

"When Interval began, we just did cool things,"

"It was 100 percent research, 0 percent development."

Interval came to be revered as perhaps the sole surviving link to the great industrial research facilities of yore - the labs at IBM, AT&T, and Xerox PARC, which themselves have become increasingly commercial and product-driven.

Liddle, a veteran of PARC, strove to take the hard lessons of that famous institution - which managed to foster brilliant ideas but not profit from them - and reinvent the form.

An unusual hybrid between an industrial-research lab and a venture capital fund, Interval was conceived to live off the proceeds of its ideas.

It would seek out commercial applications without sacrificing creative leaps. Liddle has described this hybrid model as "a PARC without a Xerox."

Allen's original $100 million commitment to Interval has doubled by now (not including the money he spent last year to buy the Page Mill Road office complex that houses the lab).

So far, neither he nor the public has much to show for it: some art installations and videos, a touring tent full of computer games, a musical "stick" played by Laurie Anderson, and five spinoff Valley startups.

The lab has also been resolutely private. On the day it opened its doors, it closed them, wrapping itself in a cloud of secrecy.

"I've been visiting Interval since it opened," says Jim Crutchfield, a physicist at the Santa Fe Institute who has worked with Rob Shaw, "and I still have no idea what it does."

Liddle is forthright about what Allen and Interval have learned from their failures: "No more music, no more games."

Interval's history can be divided into three periods: In the early days, everything in Paul Allen's wired world was open to exploration. Then in the middle years, the lab went its own way and they saw less of Allen in Silicon Valley, except when he came down to play his guitar at the summer picnic. Now there's this new phase, coinciding with Allen's push into the cable industry. "For the first time," Bonnie Johnson says, "he has articulated broadly what he'd like to hear from us."

"There is a social contract here," he says. "We don't make as much money as we could working for a startup company. Nor do we get public recognition because our research is kept secret. In exchange, we get to work on stuff really at the edge. That's why we're here. This is a watershed moment for a lot of us. We wonder whether the new management understands this social contract."

Resources

Elixir: a low floor high ceiling language for your projects

Elixir is a dynamic, functional language for building scalable and maintainable applications.

Elixir is successfully used in web development, embedded software, data ingestion, and multimedia processing, across a wide range of industries.

Elixir leverages the Erlang VM, known for running low-latency, distributed, and fault-tolerant systems.

You may be thinking "isn't this premature optimization? I would like to keep it simple"

If it helps you can see Elixir as the language version of Postgres, a simple technology that allows you to start quick and simple but also scales even beyond what you may need.

In fact Elixir and Postgres may be all you need for a long time, let's see why.

Skin in the game disclaimer: I've been developing and running systems in production with some of this technologies for the last 10 years, my latest product instadeq which makes heavy use of dynamic webhooks and websockets is built using Elixir.

Low Floor

Maybe it's because José Valim the creator of Elixir is a really nice person.

Or maybe because the Elixir community has a big influence from the Ruby community (José used to be a Ruby on Rails Code Team member) where they have the mantra "Matz is Nice and So Are We".

No matter the reason, it's a fact that the Elixir community is really welcoming and cares a lot for the developer experience, this reflects on the tight integration between the language and its tooling:

  • mix build tool
  • hex package manager
  • iex REPL

Even release management is built in the officially maintained workflow.

But the development experience doesn't stop with the Elixir team, probably inspired by Ruby on Rails, the community has created tightly integrated frameworks on top of the language.

Batteries Included

The most known one is the Phoenix Framework that allows you to "Build rich, interactive web applications quickly, with less code and fewer moving parts."

Phoenix doesn't stop at making the development of web applications easier, it also provides observability tools like Phoenix.LiveDashboard which "provides real-time performance monitoring and debugging tools for Phoenix developers"

With libraries like Ecto "A toolkit for data mapping and language integrated query" and Absinthe "The GraphQL toolkit for Elixir" you have everything you need to get started so you can focus on writing the code that's relevant to your project.

Even as your requirements grow you may find the solution to your problem already available without having to add an external service, things like in-memory key-value stores, long running requests, persistent data, background jobs and service crash recovery among others are already supported by the language and its VM keeping your architecture simple as you grow.

Read more here: You may not need Redis with Elixir

High Ceiling

As mentioned above, you can start simple and stay simple even as your requirements and load grow, but how far can it go?

Here are some articles covering the topic:

Proven Track Record

It may seem that Elixir is an unproven technology, at least a new one, but its foundations (covered later in the post) have been running in production for over 3 decades, here are some Elixir success stories:

  • PaaS with Elixir at Heroku
  • Postmates: On-demand delivery company based in San Francisco
  • Podium: Podium is an Interaction Management™ platform that enables 30,000+ businesses with a local presence to communicate more effectively with their customers
  • Supabase: Listens to changes in a PostgreSQL Database and broadcasts them over WebSockets
  • DNSimple: Simple, Secure Domain Management
  • Farmbot: Open-source CNC farming machine
  • Mux: real-time performance monitoring and analytics for video streaming
  • nextjournal: An evolving platform for computer-aided research
  • Ably: A realtime data stream network PaaS
  • Bleacher Report: Sports journalists and bloggers covering NFL, MLB, NBA, NHL, MMA, college football and basketball, NASCAR, fantasy sports and more
  • Brex: Software and services engineered for fast-growing companies
  • Cabify: A safer, ethical and innovative taxi app alternative
  • Discord: A VoIP, instant messaging and digital distribution platform

Check here for more Elixir Companies

No Javascript, if you are into that

There has been a movement lately to create a stack where the frontend can also be written in Elixir, the most known library for this is called LiveView, you can read the initial announcement here: Phoenix LiveView: Interactive, Real-Time Apps. No Need to Write JavaScript.

Here's a more up-to-date demo: Build a real-time Twitter clone in 15 minutes with LiveView and Phoenix 1.5.

An alternative in the space is Surface UI: A server-side rendering component library for Phoenix.

Stating typing, if you want

If you like static typing there's something called Typespecs, they are similar to typescript, since they are type annotations that can be checked by an external tool but don't stop the language from running if the annotations are wrong or incomplete.

If you would like a "real" statically typed language there's one on the platform that's growing in stability and adoption called Gleam that can be used in your Elixir projects

Path to scalability, if you need it

Let's dream big, you get hockey stick adoption and need to scale horizontally.

You can use libcluster or peerage to form static or dynamic clusters of nodes.

For specific distributed system architectures like the dynamo architecture there are libraries like Riak Core Lite (I'm one of the maintainers :)

Also: Embedded, IoT, Multimedia, Data Science, Machine Learning and more

Lately there has been a lot of activity to support Data Science and Machine Learning workflows completely inside the platform, some examples:

  • Livebook: Write interactive & collaborative code notebooks in Elixir
  • Numerical Elixir is an effort to bring Elixir to the world of numerical computing and machine learning. The foundation of this effort is a library called Nx, that brings multi-dimensional arrays (tensors) and just-in-time compilation of numerical Elixir to both CPU and GPU

For data engineering projects you can use tools like Broadway a concurrent and multi-stage data ingestion and data processing toolkit.

IoT has been an active area for a while, with mature projects like:

  • Nerves: the open-source platform and infrastructure you need to build, deploy, and securely manage your fleet of IoT devices at speed and scale
  • GRiSP: The GRiSP project makes building internet-connected hardware devices easier with Erlang & Elixir
  • Kry10 Secure Platform The Kry10 Secure Platform (KSP) is a breakthrough Operating System and Support Service built on the world-class seL4, Erlang, and Elixir technologies

Standing on the Shoulders of Giants

You may read that Elixir runs on top of Erlang/OTP, what is that?

Erlang is a programming language used to build massively scalable soft real-time systems with requirements on high availability. Some of its uses are in telecoms, banking, e-commerce, computer telephony and instant messaging.

Erlang's runtime system has built-in support for concurrency, distribution and fault tolerance.

OTP is a set of Erlang libraries and design principles providing middleware to develop these systems.

Some systems built with Erlang/OTP:

  • VerneMQ: A high-performance, distributed MQTT broker
  • EMQX: An Open-Source, Cloud-Native, Distributed MQTT Message Broker for IoT
  • RabbitMQ: The most widely deployed open source message broker
  • CouchDB: Seamless multi-master sync, that scales from Big Data to Mobile, with an Intuitive HTTP/JSON API and designed for Reliability
  • Riak KV: a distributed NoSQL key-value database with advanced local and multi-cluster replication
  • MongooseIM: A robust and efficient chat (or instant messaging) platform aimed at large installations
  • EJabberd: Robust, Scalable and Extensible Realtime Platform XMPP Server + MQTT Broker + SIP Service

Some companies using it:

  • Inside Erlang, The Rare Programming Language Behind WhatsApp’s Success
  • Klarna: Erlang powers the core of Klarna’s system serving millions of customers in Europe
  • AdRoll: uses Erlang within the live monitoring of their real-time bidding system. This involves live monitoring everything that could go wrong on a system receiving 500K+ bid requests per second
  • Flussonic: Erlang is used to capture, record and stream video at 10-20 Gbit/s: TV channels, IP cameras, webinars

Check here for more Erlang Companies

Conclusion

If you are looking for a stack that "Makes easy things easy and hard things possible" without requiring a rewrite or migration you may want to take a look at Elixir.

To get started check the Getting Started Guide, join the Elixir Forum or check some of the available books.

How Visual is Your Language? Semantic Mutation Testing

/galleries/post-images/visual-mutation-testing/dimensions.jpg

What is Mutation Testing?

Mutation analysis is defined as using well-defined rules defined on syntactic structures to make systematic changes to software artifacts.

Mutation testing is defined as using mutation analysis to design new software tests or to evaluate existing software tests.

It consists on mutating a program and checking if the results differ from the original.

Visual Languages

When creating a visual language we can use many dimensions (syntax) like color, position, order, shape, orientation, texture, size and others to define language semantics.

The thing is that when drawing on a grid of pixels we will "accidentally" use other dimensions that add no extra meaning to our programs.

Visual Mutation Testing

To test how visual our language is and to notice which dimensions we are "wasting" I propose to do mutation testing on those dimensions and see if the meaning of the program changes.

Why?

Imagine a textual language that required us to name things or write symbols/sections that aren't used for anything in the program.

If a visual language doesn't give any meaning to absolute and relative position of items and the length and shape of the connections carries no extra meaning, then why have them?

How many "box and arrow" languages are just scratch with arrows between the blocks?

Seen from the other side, each wasted dimension is an opportunity to encode meaningful information about the program.

Below are some "rules" to apply and check if the dimension has any meaning.

Mutations by Dimension

Color

  • Display in black and white

  • Display in grayscale

  • Changing Hue, Saturation and/or Lightness of colors

Position

  • Move one value in the canvas by X and/or Y

Order

  • If A and B are related and A comes before B horizontally and/or vertically change their order

Shape

  • Swap shapes

  • Turn a shape into another

Connections

  • Make a connection shorter, longer or of length 0

  • Make the connection wider or narrower

  • Change connection shape/angles/path

  • If a connection has a direction, revert it or remove it

    • There are languages were the flow direction is specified by something else, like node type

Orientation

  • Rotate shape by N degrees

Texture

  • Change/Remove textures

Size

  • Make things bigger/smaller

Dimension Redundancy

  • If a mutation is applied to one of the dimensions above, must another dimension be altered to keep the new version equivalent to the original one?

    • Not necessarily a bad thing, having a redundant dimension for something like color may be useful for people with color vision deficiency

Any others you can think of?

What's the most/least visual language according to this criteria?

Let me know @warianoguerra

No-code History: Lotus Improv - Spreadsheets Done Right (1991)

/galleries/post-images/nocode-history-lotus-improv/improv-1.jpg

Below are all slightly edited quotes from the material listed in the Resources section, emphasis mine. My notes prefixed with 💭

Introduction

One of the hardest things to do with a computerized spreadsheet like Lotus' 1-2-3 is to lay out the initial modeler.

What should go in the rows? What should go in the columns?

/galleries/post-images/nocode-history-lotus-improv/improv-step-1.jpg

Fundamentally, even the most basic spreadsheet program will let the user put a number or a formula in any cell desired. It's a lot of power --- a lot more than you need for most applications.

Enter Pito Salas, a bright developer in the Advanced Technology Group. Pito's project was to look at a variety of complicated models that had been built with conventional spreadsheets and see what they had in common.

/galleries/post-images/nocode-history-lotus-improv/improv-step-2.jpg

Pito looked at financial statements, revenue forecasts, and future tax estimates, to name a few. He discovered that most spreadsheets have many patterns in them. If a spreadsheet program could be taught to understand those patterns, he realized, he could make it easier to build and use complicated models.

Within a few months, Pito had come up with the fundamental idea at the core of Improv: that the raw data in a spreadsheet, the way that the user views the data, and the formulas used to perform calculations can all be separated from each other.

/galleries/post-images/nocode-history-lotus-improv/improv-step-3.jpg

The formulas should be general, so that the user can type something like PROFIT = PRICE - COST and have the spreadsheet calculate every PROFIT cell from its corresponding PRICE and COST cells.

The user should be able to rearrange the views to highlight the information and relations that she is trying to convey. And the data itself should be put into a multi-dimensional database. A slick interface should sit on top to make it easy to get information in and out.

The result was Improv, a multi-dimensional spreadsheet product with natural language formulas and dynamic views.

History

In 1986, Pito Salas joined the Advanced Technology Group at Lotus to think about a totally new kind of spreadsheet.

The decision was made in September 1988 to go ahead with the "Back Bay" project.

After experimenting with interfaces and a database engine under DOS and the Macintosh operating system, the group decided that the product would be based on OS/2 and Microsoft's Presentation Manager. They even picked a mascot --- Fluffy Bunny --- and started up an underground newsletter, "Fluffy Bunny Goes to Back Bay".

In October 1988, Steve Jobs came to Lotus to show off his new computer. After the talk, Lotus' top management did a private show-and-tell for Steve of their most interesting products that were under development.

Pito showed Steve a clunky, character-based, primitive spreadsheet, but all of the elements of the future were there: there were formulas at the bottom of the spreadsheet, rather than integrated in the cells; it was multi-dimensional; and the user could instantly call up different views of the same data set.

Immediately, Jobs wanted Back Bay for the NeXT.

/galleries/post-images/nocode-history-lotus-improv/lotus-improv-ad.jpg

Another reason that Lotus decided to go with NeXT, says Jeff Anderholm, was that the NeXT didn't run 1-2-3, Lotus' cash cow. "We didn't have to worry about any [marketing] conflict with 1-2-3".

By January 1989, Improv didn't have category tiles. Instead, all of the view rearrangement was done with menu commands.

Then the group hit upon the idea to use icons. "We realized that if we represented these things as icons, all these manipulations could be represented by moving icons from one place to another".

But where should the icons for the categories go? After trying a lot of different ideas, the developers decided to create a special icon window.

"And then Steve Jobs came", says Paul, remembering Job's visit in April 1989.

Jobs then said that the category manipulation had to be more direct. "You have to be able to touch the categories and move them around. Having them off in a separate window is too removed", Paul remembers.

"He didn't even want to have the tiles; he wanted to just move them around. He's really a fanatic for direct manipulation, and it really shows".

Jobs didn't have an answer, says Paul, but "one of the benefits of that [meeting] was we junked the idea of the extra panel", and put the category tiles on the worksheet itself.

The product was released for the NeXT brand computers in 1989 as Improv.

Lotus chose not to include this functionality in their flagship Lotus 1-2-3 product. Instead, Lotus Improv for Windows came out in 1991.

How it Works

Column letters, row numbers, and cell formulas, the main source of frustration for spreadsheet users, are all gone.

In their place are rows and columns labeled in plain English, and an independent list of formulas that use those labels, making Improv, in essence, a relational spreadsheet.

/galleries/post-images/nocode-history-lotus-improv/improv-formula.jpg

For example, suppose you have rows labeled

  • UNITS BOUGHT

  • UNITS SOLD

  • WHOLESALE PRICE

  • RETAIL PRICE

  • EXPENSES

  • GROSS SALES

  • NET PROFITS

In the formula panel, you would enter the following formulas:

  • EXPENSES = UNITS BOUGHT * WHOLESALE PRICE

  • RETAIL PRICE = 1.4 * WHOLESALE PRICE

  • GROSS SALES = UNITS SOLD * RETAIL PRICE

  • NET PROFIT = GROSS SALES - EXPENSES

/galleries/post-images/nocode-history-lotus-improv/lotus-improv-worksheet-1.jpg

Now, no matter how those rows grow or shrink in size, and no matter where they appear in your spreadsheet, the appropriate calculations always take place.

Other innovative features abound. You can easily rearrange a spreadsheet by moving around small tokens that represent row or column categories.

You may open multiple windows to a spreadsheet, allowing you to view (and change) data in several different ways simultaneously.

Rather than use letters and numbers to describe data, it lets you use real words, like "Tons" and "Dollar Value." Or anything you are comfortable with.

The benefit of this is that now your formulas read like English. Instead of seeing something like =BD2*BD3, you see Dollar Value = Tons * 5.75

/galleries/post-images/nocode-history-lotus-improv/improv-categories.jpg

And Improv lists all your formulas in one place, as opposed to hiding them in individual cells.

So when you revisit a complicated spreadsheet months later, it's sure to make sense. Likewise if you're looking at a spreadsheet that's been designed by someone else.

All you do is use the mouse to click one of the category "tiles" located along the edges of the spreadsheet - such as "Region" or "Material"- and drag it to a new location.

Improv allows you to move your column and row headings from one part of the spreadsheet to another, even interchange them - and without the slightest hesitation, the spreadsheet will automatically rearrange itself.

💭 For more usage examples check:

Programmability

Improv comes with LotusScript, which lets you build custom applications and front ends for any Lotus application.

If you have a basic programming experience, LotusScript makes understanding the process of creating custom applications relatively simple.

You can attach a script to a model or save it independently and use it with other models.

LotusScript and Lotus Dialog Editor give Improv all the tools necessary to create a custom front end or complete custom application.

Why It Failed

Lotus marketed Improv more as "spreadsheets done right" (referring to the separation of data and formulas, and the more rigid structure of an Improv model) rather than it's OLAP capabilities, which unfortunately had the effect of confusing those customers who now had to choose between 1-2-3 and Improv, and instead chose Microsoft Excel instead.

From an architecture viewpoint, Improv was also limited by the fact that its cubes ran in memory rather than being paged to disk, so it was always limited in what it could hold, especially with the typical amount of memory a PC had then.

💭 A comment from Jeff Anderholm in 1991 that points to the need to train users

We have to figure out what we can add to the product to help people learn it, because you have to unlearn what you know about conventional spreadsheets like Excel and 1-2-3. Our challenge is to convince people that the benefits of this new spreadsheet are worth the cost of switching.

💭 First person here is Salas

It’s hard to argue that one of the keys is the maleability of the spreadsheet as a medium. The fact that a spreadsheet can grow organically, be modified and grown in a kind of an Improvisational manner. But when spreadsheets get complicated they get messy and error-prone and this is what Improv set out to address.

In the end it didn’t go anywhere, probably because in setting out to improve on spreadsheets, Improv lost the essence of a spreadsheet and in doing so lost the market.

Innovators Dilemma.

I am not sure it applies, but one could argue a parallel here with Improv. In particular this would lead you to the conclusion that the key strategy mistake was to try to market Improv to the existing spreadsheet market. Instead, if the product were marketed to a segment where the more structured model was a ‘feature’ not a ‘bug’ would have given Lotus the time to learn and improve and refine the model to a point where it would have satisfied the larger market as well.

  1. Lotus was positioning Improv as a spreadsheet replacement, rather than a specialized tool to better perform an important subset of tasks currently performed with a spreadsheet.

  2. Lotus was in the throes of a heroic battle for survival against Microsoft’s Excel – causing undue pressure on the company to make its product portfolio clean and understandable, and to organize all resources behind the flagship product. Introducing new technology costs in a scenario such as that.

/galleries/post-images/nocode-history-lotus-improv/improv_box_back_medium.jpg

Source

Resources

Books

Media

See Also

Spreadsheets as a Physical Device

While researching for the next post about No-code History I came across something more people should know about.

The Sharp 3 Dimensional Spreadsheet Organizer from 1990

/galleries/post-images/sharp-3d-spreadsheet/sharp-3d-spreadsheet-device.jpg

From the Manual:

Whether you are a financial executive, a salesman, an entrepreneur, or just someone who needs to handle numbers, you will find Spreadsheet IC Card an indispensable tool.

It allows you to carry the power of a desktop PC spreadsheet in your pocket.

Also, you will find Spreadsheet IC Card very easy to use because:

  • 18 dedicated keys allow you to execute the functions with just one keystroke. Moreover, because the names of the functions are printed on the keys, you do not have to memorize anything.

  • 3-D feature enables you to access and manipulate a large amount of data on a small screen.

  • Help key permits you to get assistance while you are on the road.

  • Built-in templates help you quickly tap the power of Spreadsheet IC Card to gain greater control over your day-to-day finances and sales calls.

  • Lotus 1-2-3 and Lucid 3-D compatibility lets you transfer Lotus 1-2-3, Lucid 3-D, or compatible worksheets between the Organizer and a PC at your office or home (by using the Spreadsheet Link program).

We truly believe you will enjoy using Spreadsheet IC Card the same way PC customers enjoy using the Lucid 3-D spreadsheet.

/galleries/post-images/sharp-3d-spreadsheet/sharp-3d-spreadsheet-usage.jpg

Be careful while carrying your spreadsheet

It seems there were a couple of them:

/galleries/post-images/sharp-3d-spreadsheet/sharp-3d-spreadsheet-manual.jpg

Manual Cover

Resources:

No-code History: Peridot - UIs by Example, Visual Programming & Constraints (1987)

/galleries/post-images/nocode-history-peridot/peridot.jpg

Below are all slightly edited quotes from the material listed in the Resources section, emphasis mine.

Introduction

Peridot is an experimental tool that allows designers to create user interface components without conventional programming.

The designer draws pictures of what the interface should look like and then uses the mouse and other input devices to demonstrate how the interface should operate.

Peridot uses visual programming, programming by example, constraints, and plausible inferencing to allow nonprogrammers to create menus, buttons, scroll bars, and many other interaction techniques easily and quickly.

Peridot created its own interface and can create almost all of the interaction techniques in the Macintosh Toolbox.

Peridot demonstrates that it is possible to provide sophisticated programming capabilities to nonprogrammers in an easy-to-use manner and still have sufficient power to generate interesting and useful programs.

In order to allow interaction technique procedures to be created in a direct manipulation manner, Peridot has the designer provide example values for each parameter.

For instance, when creating a menu, the designer provides an example list of strings to be displayed in the menu.

Using a technique called programming by example, Peridot generalizes from the given examples to create a general-purpose procedure.

An important component of Peridot is the use of constraints, which are relationships among objects and data that must hold even when the objects are manipulated.

Peridot uses two kinds of constraints. Graphic constraints relate one graphic object to another, and data constraints ensure that a graphic object has a particular relationship to a data value.

The motivation for this style is that people make fewer errors when dealing with specific examples rather than abstract ideas. The programmer does not need to try to keep in mind the large and complex state of the system at each point of the computation if it is displayed on the screen. In addition, errors are usually visible immediately.

Example of Peridot in Action

/galleries/post-images/nocode-history-peridot/peridot-2-b.jpg

The designer has created a gray rectangle to represent a “drop shadow” for a button.

/galleries/post-images/nocode-history-peridot/peridot-2-c.jpg

The designer has drawn a black rectangle to represent the background of the button, and Peridot has noticed that this rectangle seems to be the same size as the gray rectangle, offset by a constant nine pixels.

/galleries/post-images/nocode-history-peridot/peridot-2-d.jpg

In the prompt area, it is asking the designer to confirm this constraint. The designer types y for “yes,” and Peridot immediately adjusts the black rectangle to be exactly the same size as the gray one.

If the gray rectangle’s size were now changed, the black rectangle’s size would change also, since a graphic constraint has been established that keeps both rectangles the same size.

/galleries/post-images/nocode-history-peridot/peridot-2-e.jpg

Next, the designer draws a white rectangle inside the black one, and Peridot correctly infers that this rectangle should be evenly nested inside the black one.

/galleries/post-images/nocode-history-peridot/peridot-2-f.jpg

The designer has selected the first element of the parameter “Items,” which is the string “Bold,” and has used that as the string to display.

Peridot infers that it is centered to the right of the white rectangle. The code that is produced for this string refers to the first element of the first parameter, whatever that is, rather than to the constant string “Bold,” so that any value used for the parameter will be displayed.

/galleries/post-images/nocode-history-peridot/peridot-2-g.jpg

Next, the designer selects all the objects created so far and specifies that they should be copied to a new position.

Peridot asks if it should look for constraints from the new copy to the old one, but this is not necessary since it is going to be part of an iteration.

/galleries/post-images/nocode-history-peridot/peridot-2-h.jpg

Next, the designer edits the second string to refer to the second element of the parameter.

At this point, Peridot notices that the designer has used the first two elements of a list in the interface, and asks whether the rest of the elements of the list should be displayed in the same way, as part of an iteration over all the elements of the list.

/galleries/post-images/nocode-history-peridot/peridot-2-i.jpg

The designer confirms this, and the rest are immediately shown.

In order to perform this conversion, Peridot has to determine which graphic objects should participate in the loop and how they should change in each cycle. Now the presentation aspects of the property sheet are finished.

/galleries/post-images/nocode-history-peridot/peridot-2-j.jpg

Next, the designer places the iconic picture of a check mark centered inside one of the boxes. This is used to show which items are selected.

/galleries/post-images/nocode-history-peridot/peridot-2-k.jpg

In order to demonstrate that this should be selectable by the mouse, the “simulated mouse” icon is used.

The real mouse cannot be used, since it is used for giving Peridot commands. The nose of the simulated mouse is placed over the check mark with the middle button down, and the MOUSEDependent command is given. Since there is only one active value (Selected-Props), Peridot guesses that the check mark should depend on this active value.

/galleries/post-images/nocode-history-peridot/peridot-2-l.jpg

Since the example value of that active value is a list, Peridot guesses that multiple items are allowed and that a check mark should appear for each one in the list. The designer is asked to confirm these guesses in the prompt window.

Peridot then shows the check marks displayed in the boxes next to Italic and Underline, since these are the current value of Selected-Props. Finally, the designer is asked whether pressing the middle button should toggle, set, or clear the selected object, and the designer types t for toggle.

The user interface is now complete, and either it can be tested with the simulated mouse, or else Peridot can be put into “Run Mode” and the real mouse can be used.

The PropSheet procedure that has been created can now be used outside of Peridot as part of application programs. It is parameterized as to the list of items that are displayed, so it can be called with an entirely different list of strings, even if that list has a different number of elements.

How Examples are Used

Many PBE systems require the user to provide multiple examples in order to generate code. In some cases, Peridot infers code from single examples. This is possible because the designer is required to explicitly give a command to cause Peridot to perform the inferencing.

For example, the designer issues the MOUSEDependent command to tell Peridot to look at the mouse position and to infer the generalization for the operation.

For iterations, however, the designer is required to give two examples, and Peridot can therefore usually infer the need for an iteration without an explicit command from the user.

Peridot also allows the designer to demonstrate conditionals that display special graphics and that serve as exceptions to the normal way the mouse dependencies work.

For example, some items of the menu might be shown in gray if they are illegal, and horizontal lines might replace certain items.

How Inferencing is Used

In order to make Peridot easier to use, it automatically guesses certain relationships. This frees the designer from having to know when and how to specify these relationships.

Peridot uses simple condition-action rules to implement these guesses. This approach is called plausible inferencing or abduction in the artificial intelligence literature. The condition part of the rules determines whether the rule seems to apply in the current context.

If the condition passes, then the designer is asked whether to apply the rule or not using an English message attached to the rule. If the designer answers “yes,” then the action part of the rule is applied, which changes the code of the procedure in order to add a graphic constraint.

The rules in Peridot are simple-much simpler than those used in typical artificial intelligence systems. Furthermore, there are only about 60 rules used in Peridot. The goal was to see if simple mechanisms would be sufficient, which seems to be true.

Peridot uses rule-based inferencing in four ways:

  1. To infer the graphic con straints that relate one object to another

  2. To infer when control structures are appropriate

  3. To infer how to create the control structures

  4. To infer how the mouse should affect the user interface

Inferring Graphic Constraints

Peridot infers how the various graphic objects are related to each other.

One reason that Peridot is more successful is that it guesses correctly more frequently, since it only needs to deal with the relationships that are typical in user interfaces, rather than all possible relationships that might be used in a general drawing.

If the designer wants other relationships, they can be explicitly specified, or if they occur frequently, a programmer can easily add them to the rule set.

Another reason for Peridot’s success is that it assumes that guesses will occasionally be incorrect. Therefore, it always reports to the designer the rule that it is planning to apply and allows the designer to confirm or prevent its application.

This gives the designer confidence that the system is not mysteriously doing strange and possibly erroneous things.

In addition, the results of the inferences are always immediately visible (the objects redraw themselves after every rule is applied), so the designer can view the results and see whether they were correct or not.

Another benefit of inferring graphic constraints is that they allow the designer to draw the picture quickly and sloppily, and then Peridot automatically “beautifies” the picture by enforcing the constraints.

The rules that Peridot applies are specific to the types of objects drawn. For example, it is more likely for a string to be centered at the top of a rectangle than it is for another rectangle to be.

Some of the rules specify all of the properties of an object. Examples of these are that a rectangle is the same size as another rectangle, that it is nested inside the other rectangle, or that a string is centered vertically to the right of a rectangle.

Other rules only constrain some of the properties of an object. For example, one rule might cause the width and left of a rectangle to be constrained by another rectangle, and another rule may constrain the top and height by a string.

In general, there are constraints for most of the simple relationships found in typical user interfaces.

There are currently 50 rules, and these are all listed in. Of these, 16 were added based on user testing.

Since most of the additional rules were added from the initial users and no new rules were needed for later users, it is expected that few new rules will be needed in the future.

Peridot goes through the rules in order, trying each test. The order is determined by the types of the objects, by the specificity of the rule (the rules that constrain all of the properties of the object are checked first), and by which ones seemed to be the most common.

If the constraint has parameters, such as how far apart the objects should be, the designer can answer “almost” and supply a new value for the parameters. If the designer answers “no”, then other rules are attempted.

Inferring Control Structures

Peridot automatically infers when control structures such as iterations are appropriate.

Iterations are inferred whenever the first two elements of a list are used.

To create a dependency on an active value or a parameter, the designer must explicitly select an element of these in the upper window and then specify which property of the object depends on the selection.

Conditional control structures are automatically inferred when objects depend on the mouse. In addition, the designer can explicitly specify that either a conditional or an iteration is desired by executing commands from the menu.

Differentiating Variables from Constants

After the objects that participate in a control structure are identified, Peridot must determine which properties of the objects are constant and which change.

It has been found with previous systems that inferring variables from constants is difficult, but Peridot’s simple mechanism has been successful. Again, this is due to the limited domain; graphic objects in user interfaces change typically in simple ways.

Inferring Mouse Operations

When the designer gives the MOUSEDependent command, Peridot looks under the simulated mouse to determine which objects are affected and where the mouse should be for the operation to be active.

The designer specifies when the operation should happen by toggling the state of the buttons on the simulated mouse. The interaction can start after single or multiple buttons presses (e.g., double-clicking) and either on the down or up transition of the button.

Next, Peridot infers which object should be affected by the mouse.

Then, Peridot infers how the objects should change with the mouse. The possibilities are 1. to choose one or more out of a set of objects (e.g., controlling which objects are selected in the property sheet or menu, 2. to move in a fixed range, 3. to move or change size freely 4. to blink on and off in place.

Peridot guesses which of these is appropriate by looking at the constraints on the graphic objects that are affected by the mouse.

The Language

Because Peridot creates user interface procedures, it operates as a code generator.

The code generated by Peridot has a number of conventional parts: straightline code, iterations, conditionals, and parameterized procedures.

Straight-Line Code

As the user is drawing objects, Peridot creates LISP code that will draw them for application programs. If the user edits an object, the code that generates it is modified.

If properties of objects are fixed and unchanging, then their values will be constants. If the properties are to change at run time based on parameters to the procedure or end-user input, they are controlled by constraints.

If the objects themselves appear and disappear at run time, they must be enclosed in conditionals or iterations.

Users are not allowed to edit the text code.

Iterations

Iterations are important because they allow Peridot to support variable-length lists and they relieve the designer from having to perform tedious, repetitive actions. Peridot infers iterations when two items from a list have been used.

There are two forms of iterations in Peridot. The most common form displays a copy of one or more graphic objects for each item of a list.

The items in the list can be used to control any property of the graphic objects in the iteration.

The other form for iterations is to display a set of objects for a specific number of times.

This is mainly useful for displaying a line of identical objects. To get this form of iteration, the designer creates two copies of the objects to be repeated, selects them, and then executes the Peridot Iteration command.

Conditionals

Conditionals in Peridot are used to support displayed feedback over one of a set of objects and to control an object blinking on and off.

Conditionals are created in a postfix style; that is, the designer first draws the graphic objects that are used as feedback when the conditional is true and then specifies what these objects should depend on. This allows the designer to use the standard drawing and editing commands to create the graphic objects.

Parameters and Return Values

An important property of the code that Peridot generates is that the procedures are parameterized.

This provision for parameters is the most significant difference between Peridot and other graphic user interface tools. Other systems like NeXT’s Interface Builder only allow the designer to specify a fixed set of values for the menus and buttons.

Visual Programming Aspects

An advantage in Peridot is that the system is not trying to address general-purpose programming, as in many other visual-programming languages. Therefore, more specialized techniques can be used.

Some parts of the user interface are not fully visible in Peridot. For control structures, the designer only sees the result, and there is no indication whether the objects were created due to an iteration or a conditional.

Mouse dependencies are even more abstract and do not appear in the normal graphic display. The designer must either exercise the interface or give a command to have the interactors listed in order to know what has been created.

One of the problems of many visual-programming systems is that they cannot handle large programs due to a lack of modularization. In Peridot this is not a problem, since parameterized procedures are created that can be combined into full interfaces.

Each user interface element is defined separately and encapsulated in its own procedure, so the designer can create interfaces out of small, modular, well-structured pieces.

Editing Programs

It is harder to edit control structures and mouse interactions, since they do not have visual representations on the screen that can be selected.

For editing control structures, the designer can simply select any graphic object and give an editing command. If that object is part of a control structure, Peridot will inquire whether a modification to the control structure itself is desired or whether there should be an exception to the normal way the control structure works.

If the designer specifies that the control structure itself should be edited, then Peridot returns the display to the original objects from which the control structure was created.

For an iteration, this is the original two sets of elements, and for a conditional, it is the original one element.

Now the designer can use all the normal editing commands to change the picture as desired. When editing is complete, then the Iteration or Conditional command is given to reinvoke the control structure.

This technique is used for three reasons.

First, it is easier to ensure that the designer’s edits always make sense. Otherwise, if the designer changed the fourth item of a list, what would this mean?

Second, if multiple items are generated by the control structure, the designer might make intermediate edits (such as deleting an object from one group) that would cause Peridot to be unable to show the control structure consistently.

Third, the list controlling the iteration or conditional might have only 1 or 0 items in it when the designer performed the edit, in which case there would not be two groups of objects for iterations or one for a conditional, so there would be nothing for the designer to select.

Returning to the original two groups of objects allows the designer to have full freedom to edit in any way desired, using all the conventional editing commands.

It is even harder to edit mouse interactions because there is nothing to select. Peridot provides two ways to edit interactions.

First, an interaction can be redemonstrated, and Peridot will inquire if the new interaction should replace the old one or run in parallel.

The second way to edit interactions is to select an active value and give the DeleteInteractions command. Peridot then prints in the prompt window a de scription of each interaction that affects that active value, and asks if it should be deleted.

Since individual interactions are small this should not be burdensome.

The added complexity for the designer of learning extra editing commands does not seem appropriate, given the ease of respecification.

Evaluation

In order to evaluate how easy Peridot is to use, an informal experiment was run where 10 people used the system for about 2 hours each.

Of these people, five were experienced programmers, and five were nonprogrammers who had some experience using a mouse.

After about 1; hours of guided use of Peridot, the subjects were able to create a menu of their own design unassisted. This demonstrates that one basic goal of Peridot is fulfilled: Nonprogrammers are able to create user interface elements using Peridot.

Graphic Constraints

One important reason that Peridot is more complicated than a conventional drawing package is that it must deal with the parameterization of the procedures.

This implies that Peridot must know how various graphic parts of the interface change with different values for the actual parameters.

Peridot must know that the size of the shadow and outline rectangles must change based on the width of the widest string and the sum of the heights of all the strings.

It is also possible to specify explicitly the relationships by selecting two objects and providing an arbitrary arithmetic expression that relates their properties.

After a relationship is either inferred or explicitly specified, Peridot creates a graphic constraint so that the relationship will be maintained if the picture is edited or if different parameters are used at run time.

The constraints used in Peridot differ markedly from constraints in previous systems because they are simple and efficiently implemented. The primary reason for this is that only one-directional constraints are necessary. The reverse relationship is saved at design time in case the designer edits the picture.

For example, when creating a button, the first step is to create the black and then the gray rectangles. At this point, the gray rectangle’s size and position depend on the size and position of the black rectangle.

Next, the designer adds the string, and Peridot infers that the size of the gray rectangle should depend on the size of the string.

Since constraints are only one directional, this would remove the constraint that connected the gray and black rectangles. Peridot notices this and asks the designer if the constraint should be reversed. The question is asked because it is often the case that the user wants to remove or change the constraints rather than reverse them, in order to change the way the picture looks.

The dependencies of an object’s attributes are often cascaded. Peridot is careful to reverse all the necessary constraints so that the interface stays consistent.

In addition, the dependencies may go forward in the drawing order as well as backward.

If a relationship has been reversed or the user explicitly edits an attribute to depend on some object, an object may be drawn before the object it depends on is drawn.

The drawing order of objects cannot be changed, however, since newer objects can obscure older objects. Therefore, the calculation order must be different from the drawing order.

The one-directional graphic constraints in Peridot have proved to be sufficient for handling all the relationships that occur in user interface elements.

Operations that appear to require two-directional constraints are usually handled in Peridot using active values.

Data Constraints

Active values are like parameters to the procedure except that, when they change at run time, graphics are updated immediately.

Active values can be set by the application program at any time to update the graphics.

In addition, application routines can be attached to active values, and these will be called when the active value changes. Therefore, active values are also used to pass information back to the application programs.

The screen in the top Peridot window, and the displayed value is updated when the value changes. This makes the system more understandable, since the state of the system is always visible; the designer does not have to try to remember the values of the variables.

Another factor that makes active values easy to use is that the designer can type in new values for the active value using the FixActive command. This can be used to check that the graphics change appropriately.

Trivia

Peridot was implemented in Interlisp-D on the Xerox 1109 DandeTiger workstation

Peridot stands for Programming by Example for Real-time Interface Design Obviating Typing.

Resources

See Also

No-code History: Sketchpad - A man-machine graphical communication system (1963)

/galleries/post-images/nocode-history-sketchpad/sketchpad-1.jpg

Below are all slightly edited quotes from the material listed in the Resources section, emphasis mine.

Introduction (2003)

Ivan Sutherland’s Sketchpad is one of the most influential computer programs ever written by an individual, as recognized in his citation for the Turing award in 1988.

Executable versions were limited to a customized machine at the MIT Lincoln Laboratory — so its influence has been via the ideas that it introduced rather than in its execution.

After 40 years, ideas introduced in Sketchpad still influence how every computer user thinks about computing. It made fundamental contributions in the area of human–computer interaction, being one of the first graphical user interfaces. It exploited the light-pen, predecessor of the mouse, allowing the user to point at and interact with objects displayed on the screen.

Introduction (1963)

The Sketchpad system uses drawing as a novel communication medium for a computer. The system contains input, output, and computation programs which enable it to interpret information drawn directly on a computer display.

It has been used to draw electrical, mechanical, scientific, mathematical, and animated drawings; it is a general purpose system.

A Sketchpad user sketches directly on a computer display with a “light pen”.

/galleries/post-images/nocode-history-sketchpad/sketchpad-3.jpg

The light pen is used both to position parts of the drawing on the display and to point to them to change them. A set of push buttons controls the changes to be made such as ”erase”, or “move”.

Except for legends, no written language is used.

The Sketchpad system makes it possible for a man and a computer to converse rapidly through the medium of line drawings. Heretofore, most interaction between men and computers has been slowed down by the need to reduce all communication to written statements that can be typed; in the past, we have been writing letters to rather than conferring with our computers.

/galleries/post-images/nocode-history-sketchpad/sketchpad-4.jpg

The Sketchpad system, by eliminating typed statements (except for legends) in favor of line drawings, opens up a new area of man-machine communication.

Influence

Smith’s Pygmalion, heavily influenced by Sketchpad, made a more explicit argument for the cognitive benefits of this kind of direct interaction and feedback, coining the term “icon”, and making it clear that graphical images could represent abstract entities of a programming language.

Sketchpad influenced Star’s user interface as a whole as well as its graphics applications

/galleries/post-images/nocode-history-sketchpad/sketchpad-2.jpg

Sketchpad’s implementation of class and instance-based inheritance (though not called objects) predated Simula by several years.

Alan Kay’s seminal Dynabook project, which led both to the Xerox Star and to the explosion of interest in object oriented programming through his language Smalltalk, was directly influenced by Sketchpad.

Kay has written of the fact that the genesis of Smalltalk lay in the coincidental appearance on his desk of both a distribution tape of Simula and a copy of Sutherland’s Sketchpad thesis.

Motivation

Sutherland’s original aim was to make computers accessible to new classes of user (artists and draughtsmen among others), while retaining the powers of abstraction that are critical to programmers.

In contrast, direct manipulation interfaces have since succeeded by reducing the levels of abstraction exposed to the user. Ongoing research in end-user programming continues to struggle with the question of how to reduce the cognitive challenges of abstract manipulation.

Sutherland’s attempt to remove the division between users and programmers was not the only system that, in failing to do so, provided the imaginative leap to a new programming paradigm.

Design

The decision actually to implement a drawing system reflected our feeling that knowledge of the facilities which would prove useful could only be obtained by actually trying them.

Had a working system not been developed, our thinking would have been too strongly influenced by a lifetime of drawing on paper to discover many of the useful services that the computer can provide.

Early in December 1961 Professor Shannon visited TX-2 to see the work I had been doing. As a result of that visit the entire effort took new form.

As a result of including circles into the Sketchpad system a richness of display experience has been obtained without which the research might have been rather dry.

As a result of trying to improve upon conventional drafting tools the full new capability of the computer-aided drafting system has come into being.

In making the second generation drawing program, explicit representation of constraints and automatic constraint satisfaction were to be included.

The second generation drawing program included for the first time the recursive instance expansion which made possible instances within instances.

It was possible for me, armed with photographs of the latest developments, to approach a great many people in an effort to get new ideas to carry the work on to a successful conclusion.

Out of these discussions came the notions of copying definitions and of recursive merging which are, to me, the most important contributions of the Sketchpad system.

Addition of new types of things to the Sketchpad system’s vocabulary of picture parts requires only the construction of a new generic block and the writing of appropriate subroutines for that thing.

The subroutines might be easy to write, as they usually are for new constraints, or difficult to write, as for adding ellipse capability, but at least a finite, well-defined task faces one to add a new ability to the system.

Before the generic structure was clarified, it was almost impossible to add the instructions required to handle a new type of element.

In the process of making the Sketchpad system operate, a few very general functions were developed which make no reference at all to the specific types of entities on which they operate. These general functions give the Sketchpad system the ability to operate on a wide range of problems.

The rewards that come from implementing general functions are so great that the author has become reluctant to write any programs for specific jobs.

The power obtained from the small set of generalized functions in Sketchpad is one of the most important results of the research.

In order of historical development, the recursive functions in use in the Sketchpad system are:

  1. Expansion of instances, making it possible to have subpictures within subpictures to as many levels as desired.

  2. Recursive deletion, whereby removal of certain picture parts will remove other picture parts in order to maintain consistency in the ring structure.

  3. Recursive merging, whereby combination of two similar picture parts forces combination of similarly related other picture parts, making possible application of complex definitions to an object picture.

  4. Recursive moving, wherein moving certain picture parts causes the display of appropriately related picture parts to be regenerated automatically.

The major feature which distinguishes a Sketchpad drawing from a paper and pencil drawing is the user’s ability to specify to Sketchpad mathematical conditions on already drawn parts of his drawing which will be automatically satisfied by the computer to make the drawing take the exact shape desired.

For example, to draw a square, any quadralateral is created by sloppy light pen manipulation, closure being assured by the pseudo light pen position and merging of points.

The sides of this quadralateral may then be specified to be equal in length and any angle may be required to be a right angle.

Given these conditions, the computer will complete a square. Given an additional specification, say the length of one side, the computer will create a square of the desired size.

The process of fixing up a drawing to meet new conditions applied to it after it is already partially complete is very much like the process a designer goes through in turning a basic idea into a finished design.

As new requirements on the various parts of the design are thought of, small changes are made to the size or other properties of parts to meet the new conditions.

By making Sketchpad able to find new values for variables which satisfy the conditions imposed it is hoped that designers can be relieved of the need of much mathematical detail.

Arbitrary symbols may be defined from any collection of line segments, circle arcs, and previously defined symbols. A user may define and use as many symbols as he wishes. Any change in the definition of a symbol is at once seen wherever that symbol appears.

It is easy to add entirely new types of conditions to Sketchpad’s vocabulary.

Since the conditions can involve anything computable, Sketchpad can be used for a very wide range of problems.

How it Works

If we point the light pen at the display system and press a button called “draw”, the computer will construct a straight line segment which stretches like a rubber band from the initial to the present location of the pen.

Additional presses of the button will produce additional lines until we have made six, enough for a single hexagon. To close the figure we return the light pen to near the end of the first line drawn where it will “lock on” to the end exactly. A sudden flick of the pen terminates drawing.

To make the hexagon regular, we can inscribe it in a circle. To draw the circle we place the light pen where the center is to be and press the button “circle center”, leaving behind a center point. Now, choosing a point on the circle (which fixes the radius,) we press the button “draw” again, this time getting a circle arc.

Next we move the hexagon into the circle by pointing to a corner of the hexagon and pressing the button “move” so that the corner followsk the light pen, stretching two rubber band line segments behind it. By pointing to the circle and giving the termination flick we indicate that the corner is to lie on the circle.

If we also insist that the sides of the hexagon be of equal length, a regular hexagon will be constructed. This we can do by pointing to one side and pressing the “copy” button, and then to another side and giving the termination flick.

We now file away the basic hexagon and begin work on a fresh “sheet of paper” by changing a switch setting. On the new sheet we assemble, by pressing a button to create each hexagon as a subpicture, six hexagons around a central seventh in approximate position.

An entire group of hexagons, once assembled, can be treated as a symbol. The entire group can be called up on another “sheet of paper” as a subpicture and assembled with other groups or with single hexagons to make a very large pattern.

Information about how the drawing is tied together is stored in the computer as well as the information which gives the drawing its particular appearance. Since the drawing is tied together, it will keep a useful appearance even when parts of it are moved.

Again, since we indicated that the corners of the hexagon were to lie on the circle they remained on the circle throughout our further manipulations. It is this ability to store information relating the parts of a drawing to each other that makes Sketchpad most useful.

If the master hexagon is changed, the entire appearance of the hexagonal pattern will be changed.

It took about one half hour to generate the 900 hexagons, including the time taken to figure out how to do it. Plotting them takes about 25 minutes. The drafting department estimated it would take them two days to produce a similar pattern.

By far the most interesting application of Sketchpad so far has been drawing and moving linkages.

The ability to draw and then move linkages opens up a new field of graphical manipulation that has never before been available.

/galleries/post-images/nocode-history-sketchpad/sketchpad-5.jpg

One of the largest untapped fields for application of Sketchpad is as an input program for other computation programs.

The ability to place lines and circles graphically, when coupled with the ability to get accurately computed results pictorially displayed, should bring about a revolution in computer application.

With Sketchpad we have a powerful graphical input tool. It happened that the relaxation analysis built into Sketchpad is exactly the kind of analysis used for many engineering problems. By using Sketchpad’s relaxation procedure we were able to demonstrate analysis of the force distribution in the members of a pin connected truss.

A graphical input coupled to some kind of computation which is in turn coupled to graphical output is a truly powerful tool for education and design.

To draw this figure, one bay of the truss (shown below the bridge) was first drawn with enough constraints to make it geometrically accurate. These constraints were then deleted and each member was made to behave like a bridge beam.

/galleries/post-images/nocode-history-sketchpad/sketchpad-6.jpg

Applying a load where desired and attaching supports, one can observe the forces in the various members. It takes about 30 seconds for new force values to be computed.

Having drawn a basic bridge shape, one can experiment with various loading conditions and supports to see what the effect of making minor modifications is.

Since Sketchpad is able to accept topological information from a human being in a picture language perfectly natural to the human, it can be used as an input program for computation programs which require topological data, e.g., circuit simulators.

Sketchpad itself is able to move parts of the drawing around to meet new conditions which the user may apply to them. The user indicates conditions with the light pen and push buttons. For example, to make two lines parallel,

The conditions themselves are displayed on the drawing so that they may be erased or changed with the light pen language. Any combination of conditions can be defined as a composite condition and applied in one step.

Hardware

Lincoln Laboratory provided not only advice but also technical support including to date about 600 hours of time on the TX-2.

Whatever success the Sketchpad effort has had can in no small measure be traced to the use of TX-2. TX-2’s 70,000 word memory, 64 index registers, flexible input-output control and liberal supply of manual intervention facilities such as toggle switches, shaft encoder knobs, and push buttons all contributed to the speed with which ideas could be tried and accepted or rejected.

Moreover, being an experimental machine it was possible to make minor modifications to TX-2 to match it better to the problem. For example, a push button register was installed at my request.

Summary of Vital Statistics — TX-2 — December 1962

Word Length

36 bits, plus parity bit, plus debugging tag bit

Memory

256 × 256 core 65,536 words 6.0 µsec cycle time

64 × 64 core 4,096 words 4.4 µsec cycle time

Toggle switch 16 words

Plugboard 32 words

Auxiliary Memory

Magnetic Tape 2+ million words, 70+ million bits per unit (2 units in use, total of 10 planned)

Tape Speeds

selectable 60-300 inches/sec, search at 1000 inches/sec (i.e. about 1600 to 8000 36 bit words/sec)

Input

  • Paper Tape Reader: 400-2000 6 bit lines/sec

  • 2 keyboards — Lincoln writer 6 bit codes

  • Random number generator — average 57.6 µsec per 9 bit number

  • IBM Magnetic Tape (Model 729 M6)

  • Miscellaneous pulse inputs — 9 channels — push buttons or other source

  • Analog input — Epsco Datrac — nominal 11 bit sample, 27 kilocycle max. rate

  • 2 light pens — work with either scope or both on one

Special memory registers

  • Real time clock

  • 4 shaft encoder knobs, 9 bits each

  • 592 toggle switches (16 registers)

  • 37 push buttons — any or all can be pushed at once

Output

  • Paper tape punch — 300 6 bit lines/sec

  • 2 typewriters — 10 characters per second

  • IBM Magnetic Tape (729 M6)

  • Miscellaneous pulse/light/relay contacts — 9 channels (low rates)

  • Xerox printer — 1300 char. sec

  • 2 display scopes — 7 × 7 inch usable area, 1024 × 1024 raster

  • Large board pen and ink plotter — 29”×29” plotting area. 15 in/sec slew speed. Off line paper tape control as well as direct computer control.

/galleries/post-images/nocode-history-sketchpad/sketchpad-7.jpg

Lessons Learned

Had I to do the work again, I could start afresh with the sure knowledge that generic structure, separation of subroutines into general purpose ones applying to all types of picture parts and ones specific to particular types of picture parts, and unlimited applicability of functions (e.g. anything should be moveable) would more than recompense the effort involved in achieving them.

I have great admiration for those people who were able to tell me these things all along, but I, personally, had to follow the stumbling trail described in this chapter to become convinced myself.

Conclusion

We conclude from these examples that Sketchpad drawings can bring invaluable understanding to a user. For drawings where motion of the drawing, or analysis of a drawn problem is of value to the user, Sketchpad excells.

For highly repetitive drawings or drawings where accuracy is required, Sketchpad is sufficiently faster than conventional techniques to be worthwhile.

For drawings which merely communicate with shops, it is probably better to use conventional paper and pencil.

Trivia

Claude E. Shannon was the thesis supervisor.

Marvin Minsky gave advise during development.

To initially establish pen tracking the Sketchpad user must inform the computer of an initial pen location. This has come to be known as “inking-up” and is done by “touching” any existing line or spot on the display whereupon the tracking cross appears. If no picture has yet been drawn, the letters INK are always displayed for this purpose.

Resources

See Also

No-code History: Frox a Scriptable SmartTV with a Magic Wand (1991)

/galleries/post-images/nocode-history-frox/frox-1.jpg

Preface

It's hard to find content online about Frox, below are quotes from articles, books and a video presentation by Andy Hertzfeld, if you are interested in the programmable part jump straight to How Does it Work.

Below are all slightly edited quotes from the material listed in the Resources section, emphasis mine. My notes prefixed with 💭

Introduction

💭 First person below is Hartmut Esslinger

In 1987, we started a new company called frox (as in “frog electronics”), with the goal of designing, developing, and producing a fully digital multimedia entertainment system. It was a truly visionary concept that just didn’t pan out.

Essentially, we wanted to integrate video-audio entertainment and computing into one system that would apply fully digital processing to all signals and data streams. Compared to our now decades-old concept, today’s “media centers” are still well behind the curve.

For two years, the venture consumed most of our attention and energy, until we realized that neither the company nor the market was ready for the concept.

What failed us in this undertaking wasn’t the raw-force/pure-play technology we were developing. Instead, we were undone by human failure—in both the overly “corporate” management team who over-politicized the venture and overspent its funding, and the investors who didn’t fully understand the painful process of applying high-tech capabilities to a consumer-focused product.

Interestingly, after Patricia and I left the venture, the investors continued frox with a new management team and new money. They succeeded at launching the prototype, but it ultimately failed because it was too expensive and unreliable.

💭 First person below is Andy Hertzfeld

hi I'm Andy Hertzfeld and I've been working for the last year or so on developing an advanced user interface for Frox. A company involved with making the home entertainment system of the future.

I'm really excited about the system because I think it has the potential to create a revolution in the consumer electronics marketplace by combining a powerful computer as powerful as today's advanced workstations at the center of a complete home electronic system.

How Does it Work

/galleries/post-images/nocode-history-frox/frox-mouse.jpg

Notice that Andy is using a mouse here, a computer without a keyboard ;)

In designing the Frox user interface the greatest challenge was to create a user interface that is appealing both to a technophobe and a technophile.

It's very hard to design an interface that is both simple and complex, so we solve the problem by providing complete end-user configurability.

What I'm going to show you now is how the end user can use the toolbox to build their own unique environment.

I can click on the command panel and over to the right I see I have this large toolbox.

Whenever you bring up the toolbox it means the system is kind of under construction.

I can move controls around just changing their positions, or I can customize them in various ways.

The toolbox itself consists of a bunch of boxes of parts.

There's actually over a thousand independent parts in the Frox system that the user can manipulate, by clicking on a box it opens.

If I click on different entities in the boxes such as this cuckoo noise you hear a cuckoo sound.

I'll take this cuckoo noise and drop it into the left half of a button makes the noise to reinforce it's being taken.

I'll grab the boing noise and drop it into the right of the switch, from now on this the switch will sound like Cuckoo ... Boing.

/galleries/post-images/nocode-history-frox/frox-sound-customization.jpg

In a similar fashion we're in control of all the colors you see on the screen.

If I take this dab of blue and drop it here that panel becomes blue.

/galleries/post-images/nocode-history-frox/frox-color-customization.jpg

If I take this pink and drop it between the cracks it becomes pink.

I can change the color of the frog here to brown.

There's lots of other interesting parts in the toolbox browser.

You'll see that the looks of the controls are really independent of their functionality.

For example if I want to change the way this commercial switch looks but still make it a commercial switch I can choose the way I want it to look from any of these alternatives. Open one up take its shape image drop it on top of it, it'll change that one to be a different shape.

/galleries/post-images/nocode-history-frox/frox-control-customization.jpg

We've seen that we can change the looks of these controls but none of that really matters unless we can change their meaning.

The meaning of a control is encapsulated in these little nuggets of functionality called scripts.

In fact the system will come with hundreds of such scripts that can be dropped into any of dozens of different controls.

Let's look at the script associated with the stop CD button.

I can just click on that up, it opens up the script and we'll see that the script for the stop CD button is very simple.

Just is telling the CD to stop.

In a similar fashion this button here is an eject button when I press on it, it would eject the current CD.

I can get a different script that say is the play CD function and drop that into here now it becomes a play button, or now it would become a pause button.

By dropping in scripts I can change the meanings of any given control.

The real power comes in when end-users can design their own scripts.

I think it would be a good idea now to maybe write our own script from scratch so we can see how easy it is to to customize the system.

Let's turn this button here into a button so that instead of stopping the CD every time we press it it'll change the color of whatever panel we're in.

/galleries/post-images/nocode-history-frox/frox-script-1.jpg

We can get up the toolbox browser, open up the script box and we'll see the special script with a lightning bolt.

When we drag this one out it will create an entirely new script.

We'll make a little program that will change the color of whatever panel we're in.

/galleries/post-images/nocode-history-frox/frox-script-2.jpg

We'll use this pick operation which just picks one out of a box and then we'll put this box of colors next to it so we've effectively made it say pick a color.

/galleries/post-images/nocode-history-frox/frox-script-3.jpg

We'll use the set color primitive to take that color we've picked and what we'll set with it is the color of the current panel.

/galleries/post-images/nocode-history-frox/frox-script-4.jpg

There it is. We've just created a little program to set the color of the current panel.

/galleries/post-images/nocode-history-frox/frox-script-5.jpg

We can take that script and drop it into a button here.

/galleries/post-images/nocode-history-frox/frox-script-6.jpg

Put away the browsers and we'll see that when we press on the button it'll change the color of the panel we're in.

/galleries/post-images/nocode-history-frox/frox-script-7.jpg

If we hold the button down it'll repeatedly execute the script changing their color repeatedly.

I'm really proud of the system because I think it has the potential to redefine how a user interacts with their audio and video environment.

It's a revolutionary system because it gives the end-user the same level of control over his environment that a programmer typically has.

The end-user is in control of every color sound and shape that they see on the screen.

The other most revolutionary aspect of the Frox system is that it's a completely open software based system.

Unlike traditional consumer electronic systems features can be added just by sticking in a floppy disk so the system never becomes obsolete.

The Frox system that an end-user buys in 1991 will be that much better in 1994.

I hope you've enjoyed watching this demo as much as I've enjoyed creating the system, thanks.

Frox Overview

I'm going to launch it here and while it's launching make a couple apologies the main one being that the computer here has only 8 bits per pixel so it can only display 256 simultaneous colors whereas our real system will have 24 bits per pixel and be able to display 16 million colors.

The main way the user interacts with the system is through what we call a magic wand pointing device much like a normal remote control but only one button on it and the user will point at the screen and this hand on the screen tracks the movement of the magic wand.

/galleries/post-images/nocode-history-frox/frox-2.jpg

Your way of manipulating the environment is by clicking on these little controls with your hand.

You'll see that I can grab the volume control and will actually make it louder.

I can move the balance control to listen to just the left or just the right.

I have a wide variety of other controls that I'll be showing you later.

Probably the most important panel here is the switch box panel which shows you through graphics and animation all the activity currently going on in the system.

If we activate the CD we'll see the notes emanating from the CD when I hit pause on the CD will notice that the CD stops spinning.

When I start it up again as it spins in real life it spins in the switch box panel.

In a similar fashion if I pause the VHS cassette it will pause, when I play it, will begin to animate again.

We can switch between different screens using the command panel at the bottom.

One click brings it up, there's a push button here to dismiss it and then just clicking on an image of a screen will take us to that screen.

We'll look at a large video screen it's paused here, we can get it going or we can go to a variety of other screens.

One of the most unique and extraordinary benefits of the Frox system is the way it deals with your media such as your CDs.

You can select the individual CDs by their album cover, I can go to a screen where the album covers are displayed pretty large.

As we click we can see a variety of different album images corresponding to each CD that's currently accessible to the user.

I can even go to another screen here that has a very large panel so you can see every song on the CD to play, displayed all at once.

Now we're playing "Like a Rolling Stone" if we want to play "Ballad of a Thin Man" we just click on it or "Just Like Tom Thumb's Blues" or "Desolation Road".

That's the CD capability. I'll turn off the CD player now so it'll be a little easier to show you other dimensions of the system.

Reports at the Time

💭 From Chicago Tribune article

The FroxSystem revolves around a custom-designed Sun Microsystems computer workstation. A workstation is a personal computer on steroids. This computer controls and manipulates all of the audio and video in the system. It converts signals from analog to digital and processes them in the digital domain.

The FroxSystem learns all of the infrared remote control commands of your existing audio and video sources. It then takes control of the entire system with a unique one-button wireless remote called the FroxWand that operates like a flying computer mouse. Pressing a button brings up a display of the TV screen of controls for the piece of equipment you wish to operate.

/galleries/post-images/nocode-history-frox/frox-magic-wand.jpeg

The FroxVision monitor manipulates more than 360,000 pixels 60 times a second, 40 times the industry standard.

Frox offers a choice of a 31-inch direct view monitor, a 52-inch rear projection monitor, or a monster 10-foot front projection monitor.

Since computer software operates the advanced digital hardware of the FroxSystem, the system can be updated and improved without replacing the hardware. Frox supplies updates on VHS videocassettes. However, there`s an even easier method. Frox made an arrangement with satellite program provider Turner Broadcasting Co. to transmit updates invisibly on superstation WTBS, which is carried on satellite and nearly all cable systems. A portion of the TV picture you can`t see, called the vertical blanking interval (VBI) contains room for additional data.

💭 From CNN article

The TV is the focal point of the system, but what makes it all work is a built-in computer as powerful as an engineering workstation. Soon the machine will simultaneously monitor electronic databases for news or other information of particular interest, answer the telephone, watch for incoming electronic mail, and control additional home appliances even as it runs the TV or stereo. In essence, the Frox machine is an ambitious effort to give the boob tube some real smarts.

The goal: desktop video computers that users interact with, not merely another box for couch potatoes to sit and stare at. These video computers would usher in video encyclopedias and other interactive educational and training tools. They could read and display patterns of stock price quotes, and would make possible hundreds of new and elaborate computer games. Ultimately just about anybody will be able to create electronic productions that mix snippets of moving video and sound with conventional text and computer graphics. FOR EXAMPLE, you could write your mother a letter including video highlights of your daughter's birthday party or your trip to Europe, with commentary dubbed in. You would mail it to her on a single computer disk -- or, better yet, transmit it to her computer almost instantly over telephone lines. One day, video computers may even act as the futuristic videophones that telecommunications companies have promised for decades but never really delivered.

Moreover, many experts aren't so sure that ordinary people can master the exacting techniques necessary to put together a comprehensible video program, even if it's just an edited home movie. Indeed, some contend that most people would really only need or want a 'multimedia player' -- a TV or computer that allows them more control over prerecorded, professionally produced interactive video programming.

Frox was founded last year by Hartmut Esslinger, a West German whose Frogdesign firm helped devise the striking ergonomic look of most of Apple's personal computers and the Next machine.

Steve Jobs helped Esslinger refine the idea last year but had to back out to devote full time to Next. Esslinger continued on his own. To build the prototype he enlisted the help of Andreas Bechtolsheim, one of Sun Microsystems' founders; Peter Costello, another top Sun engineer; and Hertzfeld.

Trivia

If a comment in the youtube video is to be believed: "Andy developed the Frox prototype in (object-oriented!) assembly language on a processor family he KNEW wouldn't be used in the final product -- thus ensuring that the actual product wouldn't be a hacked-up expansion on the bones of the prototype."

Resources

See Also

Sketchpad and discovering by doing

While researching for the next post in the No-code history series I started noticing a pattern of quotes related to the process of discovery by creating a complete thing.

All quotes below are from a thesis described as "one of the most influential computer programs ever written by an individual, as recognized in his citation for the Turing award in 1988".

The decision actually to implement a drawing system reflected our feeling that knowledge of the facilities which would prove useful could only be obtained by actually trying them.

...

Had a working system not been developed, our thinking would have been too strongly influenced by a lifetime of drawing on paper to discover many of the useful services that the computer can provide.

As the work has progressed, several simple and very widely applicable facilities have been discovered and implemented.

...

As a result of trying to improve upon conventional drafting tools the full new capability of the computer-aided drafting system has come into being.

No-code History: GRAphical Input Language - GRAIL (1969)

Note: Almost all text below are quotes from resources listed at the end with slight editions.

/galleries/post-images/nocode-history-grail/grail-3.png

Introduction

The GRAIL (GRAphical Input Language) Project proposed to create an interactive software-hardware system in which the man constructs and manipulates the display contents directly and naturally without the need to instruct an intermediary (the machine); i.e., the display contents should represent, in a very real sense, the man's problem, and allow him to deal directly with it.

For example, consider the construction of a flowchart. An interactive system embodying these features allows a researcher to draw freehand figures and connecting lines; then it immediately replaces these figures with stylized versions of the appropriate size and at the same position to inform him that it understood his actions. If the researcher's actions are in error, the system makes this apparent; e.g., by brightening a symbol or disallowing a connecting line.

The foregoing considerations led to these design goals:

  1. Machine-to-man communication to be accomplished solely via the CRT.

  2. Man-to-machine communication to be accomplished solely via real-time interpretation of stylus/tablet motions.

  3. The environment to minimize ambiguous responses and the operation to be reasonably apparent.

  4. The system to be responsive enough for the man to consider the display his working surface with minimal distraction and delay.

  5. The system to be complete as a problem solving aid; i.e., the man should be able to specify, edit, validate (debug), document, and exercise his problem description.

The evident mismatch between output potentials and existing input capabilities led to the investigation of two-dimensional input devices. The device that resulted, known as the RAND Tablet, consists of a pen-like instrument (stylus) used on a two-dimensional surface (printed circuit tablet), which is coupled to a general-purpose computer.

The project deals with the problem of computer programming using flowcharts as a starting point from which to investigate man-machine communications within the above principles. Operations are described that allow the man to specify, edit, validate, document, and exercise his problem description by drawing and gesturing (freehand and in-place) those symbols, characters, and other means of problem expression that he may need. Continuous responses on the CRT display are necessary to minimize distraction and to allow the man to feel that he is dealing directly with the expression of his problem.

The GRAIL research experiment was designed to facilitate problemsolving by providing a useful interface between man and machine. Specifically, the project investigated techniques for the real-time interpretation of free-hand gestures (on a RAND Tablet), display representation methods, and their application to a significant problem area --constructing computer programs via flowcharting.

The system permits construction, editing, interpretive execution, compilation, debugging, documentation, and execution of computer programs specified by flowcharts.

The communication language is structured to assist the man in problem formulation by allowing specification of a problem, editing of its constructs, and validating its representation. Accurate and intelligible documentation directly results from the problem statement in GRAIL.

Motivation

The project's main goal was to identify the problems and study possible methodology for this form of man-machine communications.

Computer programming via flowcharts was chosen as a vehicle for the GRAIL project work. Flowcharting is broadly applicable and complex enough to be interesting, as well as being amenable to the proposed communication techniques.

Challenges

The man's ability to focus his attention exclusively on the display is certainly coupled to his ability to effect his intentions directly in place.

The seemingly difficult feat of looking one place while gesturing in another (such as typing or driving a car) is really no problem for the man provided the feedback loop is closed quickly enough to avoid a rubbery feeling.

The Language

The language organization centers on sequential control flow and nested subroutines coupled with flowcharts to relate their interdependence pictorially.

These notions help the man to structure his program and to envision graphically its organization in two dimensions.

Important organizational concepts in the GRAIL system are the sequential flow of control, the hierarchy of subroutines, and the language (flow diagrams) for pictorially relating the organization within the concepts of the first two.

Flow diagrams help the man to picture his control options and the relationship between processes by expressing these interrelationships in two dimensions.

The main ideas and their interrelationships constitute a conceptual plane. The next level of detail for a particular notion constitutes another conceptual plane and so on, until the lowest level of detail has been explicitly expressed by appropriate computer-language statements or flowchart symbols.

/galleries/post-images/nocode-history-grail/grail-2.png

A man may have many files or programs. Each is a diagramatically ordered collection of closed-process definitions whose instances may appear in other processes.

Each closed process is a collection of planes.

Each plane is a collection of frames implicitly coupled via connectors and may contain instances of other processes.

Each frame contains a collection of flowchart symbols or code statements.

How it Works

A man using a RAND Tablet/Stylus and a random deflection CRT display may draw flowchart symbols, edit and rearrange them on the display surface, and connect them appropriately to form a meaningful program. He may also execute the program while controlling its execution rate and the amount and content of information presented to him. The system interprets, in real-time, the man's hand-drawn figures, characters, and other stylus gestures to provide germane responses on the display surface. Operations were governed by the principles that the system should be responsive, easy to understand, easy to use, and powerful.

The GRAIL system allows the man to print text and draw flowchart symbols naturally; the system recognizes them accurately in real-time. The recognizable symbol set includes the upper-case English alphabet, the numerals, seventeen special symbols, a scrubbing motion used as an erasure, and six flowchart symbols-- circle, rectangle, triangle, trapezoid, ellipse, and lozenge.

GRAIL's text-editing features are: character placement and replacement, character-string insertions, line insertions, character and character-string deletions, and line deletions.

No positional maneuvers (e.g., moving a cursor) are required.

An alphanumeric or special symbol may be handprinted in-place (character placement); when completed, its ink track is replaced by a hardware-generated character.

When a character is printed over an existing character (character replacement), the system replaces the previous character with the newly-recognized character.

One erases by scrubbing (as in erasing a blackboard) over the character(s) to be deleted. Any number of characters within a line may be erased by a single scrubbing.

Erasure of blanks shifts the remaining characters (to the right of the blanks) leftward over the erased blanks.

One may insert a string of characters between two characters by drawing a caret (^) between them.

One may insert blank lines between existing lines by drawing a '>' symbol in the left margin.

Erasing all the characters on the line and then erasing again on the blank line deletes the line entirely.

Syntax analysis is performed on character strings where it is appropriate, and errors are indicated by brightening the entire line.

The man may execute part or all of his program from the console either by compiling the processes and executing them at CPU speeds or by interpretive execution.

The man may execute part or all of his program from the console either by compiling the processes and executing them at CPU speeds or by interpretive execution.

Interpretive execution, designed to be much more interactive, is used for debugging.

The man controls execution by starting, stopping, continuing, and terminating with simple, direct stylus actions.

He controls execution rate in either single-step or variable mode (up to a display frame-swapping rate of about 30 ms/frame) as well as the amount and content of information presented on the display.

Brightening the next graphic to be executed and scrolling the next code statement to the top of the viewing window shows the control flow through flowchart symbols and code statements, respectively.

The man may overlay or delete the changing data-value display (parameter frame) at any time; therefore, he may view any change (data value or control step) to his program.

The information displayed during interpretive execution is exactly the same picture that the man constructed. In fact, the man frequently uses the overlay (e.g. 1 parameters and flowchart) and split-screen (parameter and code state- ments) images during construction.

/galleries/post-images/nocode-history-grail/grail-1.png

Trivia

The system was implemented on an IBM System/360 Model 40-G with two 2311 disk drives as secondary store.

The capabilities of the language as a programming system were tested by writing GRAIL itself within the flowchart symbolism.

Resources

See Also