 No-code Data Analysis & Interactive Visualizations
Unlock Your Data Analyst Superpowers
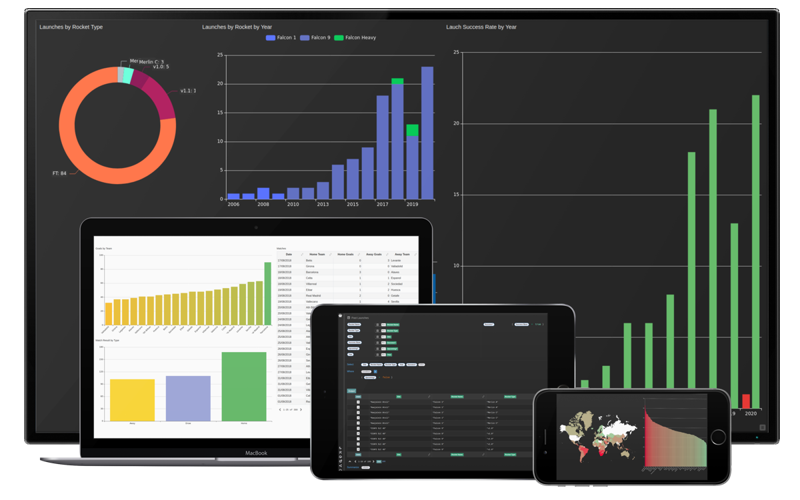
Turn Excel Spreadsheets, Google Sheets, CSV Files, JSON Files, Scripts and Integrations
into always up-to-date dashboards, no code required