Make No Code Incident Report Dashboards from Excel & Google Sheets: Part 1
Go back to the Excel/Google Sheet Guide Introduction
💭 Would you like to go over this topic with an instadeq specialist?
📅 Book a Call Free of Charge
1. Transforming Data
Create a new deck by selecting the Add Deck button on the top menu.
Create and configure a Spreadsheet card by selecting the + Add Card button before/after any card and then selecting the Spreadsheet card type from the card type selector.
To populate the Spreadsheet card with data follow the instructions above for Excel or Google Sheets.
To enrich the incoming data we need to create and configure a Select card and add the relevant columns from the Spreadsheet card either by dragging the Output columns and dropping them in the appropriate Select Query placeholder or by selecting the placeholder and then selecting the appropriate outputs from the list or selecting the add all action to add all columns from that section.
To transform the columns that contain dates as text into the date type to be able to manipulate them correctly select those columns in the query and then select the button to get a list of transformations for that column.
Select the transformation to transform from text to date and confirm the operation.
To format date columns to display days and months only select the fields in the query, select the button to get a list of transformations and select the date to text with format action, edit the new field's name and the format parameter as needed.
To calculate Days from Incident to Report select the on the Report Date Date field and select the Difference Between Dates action, change the to: parameter on the formula from the default to Incident Date Date by selecting it from the formula keyboard field list.
Remove intermediate input fields from the query if they aren't needed in the output by selecting them and then selecting the remove button and confirming the operation.
Reorder Columns in Output either by dragging the Output table columns and dropping them in their new positions or by dragging the query fields and dropping them in their new positions.
2. Average Day to Report by Month Bar Chart
Create Group By
Create a new card by selecting the + button below the Select card and pick the Group By card type.
Configure Group By
Drag the Output column Days to Report from the Select card and drop it in Select value.
Set the following aggregation type for each Select field:
Average for Days to Report
You can alternatively select the value placeholder and select Days to Report from the list that appears.
Drag the Output column Incident Month from the Select card and drop it in Group By key.
You can alternatively select the key placeholder and select Incident Month from the list that appears.
The result should look like this:
Select Average Days to Report value Group By Incident Month key
Sort the Output table:
Incident Month ascending
Create Chart
Create a new card by selecting the + button below the Group By card and pick the Chart card type.
Configure Chart
Drag the Output column Days to ReportAvg from the Group By card and drop it in Chart value.
You can alternatively select the value placeholder and select Days to ReportAvg from the list that appears.
Drag the Output column Incident Month from the Group By card and drop it in By key.
You can alternatively select the key placeholder and select Incident Month from the list that appears.
The result should look like this:
Chart Days to ReportAvg value By Incident Month key
Select Bar on the chart type selector.
3. Average Days to Report By Month and Location
Create Group By
Create a new card by selecting the + button below the Select card and pick the Group By card type.
Configure Group By
Drag the Output column Days to Report from the Select card and drop it in Select value.
Set the following aggregation type for each Select field:
Average for Days to Report
You can alternatively select the value placeholder and select Days to Report from the list that appears.
Drag the Output columns: Incident Month and Location from the Select card and drop them in the Group By key.
You can alternatively select the key placeholder and select Incident Month and Location from the list that appears.
The result should look like this:
Select Average Days to Report value Group By Incident Month Location key
Sort the Output table:
Incident Month ascending
Create Chart
Create a new card by selecting the + button below the Group By card and pick the Chart card type.
Configure Chart
Drag the Output column Days to ReportAvg from the Group By card and drop it in Chart value.
You can alternatively select the value placeholder and select Days to ReportAvg from the list that appears.
Drag the Output columns: Incident Month and Location from the Group By card and drop them in the By key.
You can alternatively select the key placeholder and select Incident Month and Location from the list that appears.
The result should look like this:
Chart Days to ReportAvg value By Incident Month Location key
Select Grouped on the chart type selector.
4. Incidents by Month and Location
Create Group By
Create a new card by selecting the + button below the Select card and pick the Group By card type.
Configure Group By
Drag the Output column Incident Month from the Select card and drop it in Select value.
Set the following aggregation type for each Select field:
Count for Incident Month
You can alternatively select the value placeholder and select Incident Month from the list that appears.
Drag the Output columns: Incident Month and Location from the Select card and drop them in the Group By key.
You can alternatively select the key placeholder and select Incident Month and Location from the list that appears.
The result should look like this:
Select Count Incident Month value Group By Incident Month Location key
Sort the Output table:
Incident Month ascending
Create Chart
Create a new card by selecting the + button below the Group By card and pick the Chart card type.
Configure Chart
Drag the Output column Incident MonthCount from the Group By card and drop it in Chart value.
You can alternatively select the value placeholder and select Incident MonthCount from the list that appears.
Drag the Output columns: Incident Month and Location from the Group By card and drop them in the By key.
You can alternatively select the key placeholder and select Incident Month and Location from the list that appears.
The result should look like this:
Chart Incident MonthCount value By Incident Month Location key
Select Stacked on the chart type selector.
5. Incidents by Day and Severity
Create Group By
Create a new card by selecting the + button below the Select card and pick the Group By card type.
Configure Group By
Drag the Output column Incident Day from the Select card and drop it in Select value.
Set the following aggregation type for each Select field:
Count for Incident Day
You can alternatively select the value placeholder and select Incident Day from the list that appears.
Drag the Output columns: Incident Day and Severity from the Select card and drop them in the Group By key.
You can alternatively select the key placeholder and select Incident Day and Severity from the list that appears.
The result should look like this:
Select Count Incident Day value Group By Incident Day Severity key
Sort the Output table:
Incident Day ascending
Create Chart
Create a new card by selecting the + button below the Group By card and pick the Chart card type.
Configure Chart
Drag the Output column Incident DayCount from the Group By card and drop it in Chart value.
You can alternatively select the value placeholder and select Incident DayCount from the list that appears.
Drag the Output columns: Incident Day and Severity from the Group By card and drop them in the By key.
You can alternatively select the key placeholder and select Incident Day and Severity from the list that appears.
The result should look like this:
Chart Incident DayCount value By Incident Day Severity key
Select Stacked on the chart type selector.
6. Consequences by Place
Create Group By
Create a new card by selecting the + button below the Select card and pick the Group By card type.
Configure Group By
Drag the Output column Place from the Select card and drop it in Select value.
Set the following aggregation type for each Select field:
Count for Place
You can alternatively select the value placeholder and select Place from the list that appears.
Drag the Output columns: Place and Consequence from the Select card and drop them in the Group By key.
You can alternatively select the key placeholder and select Place and Consequence from the list that appears.
The result should look like this:
Select Count Place value Group By Place Consequence key
Sort the Output table:
Place ascending
Consequence ascending
Create Chart
Create a new card by selecting the + button below the Group By card and pick the Chart card type.
Configure Chart
Drag the Output column PlaceCount from the Group By card and drop it in Chart value.
You can alternatively select the value placeholder and select PlaceCount from the list that appears.
Drag the Output columns: Place and Consequence from the Group By card and drop them in the By key.
You can alternatively select the key placeholder and select Place and Consequence from the list that appears.
The result should look like this:
Chart PlaceCount value By Place Consequence key
Select Heatmap on the chart type selector.
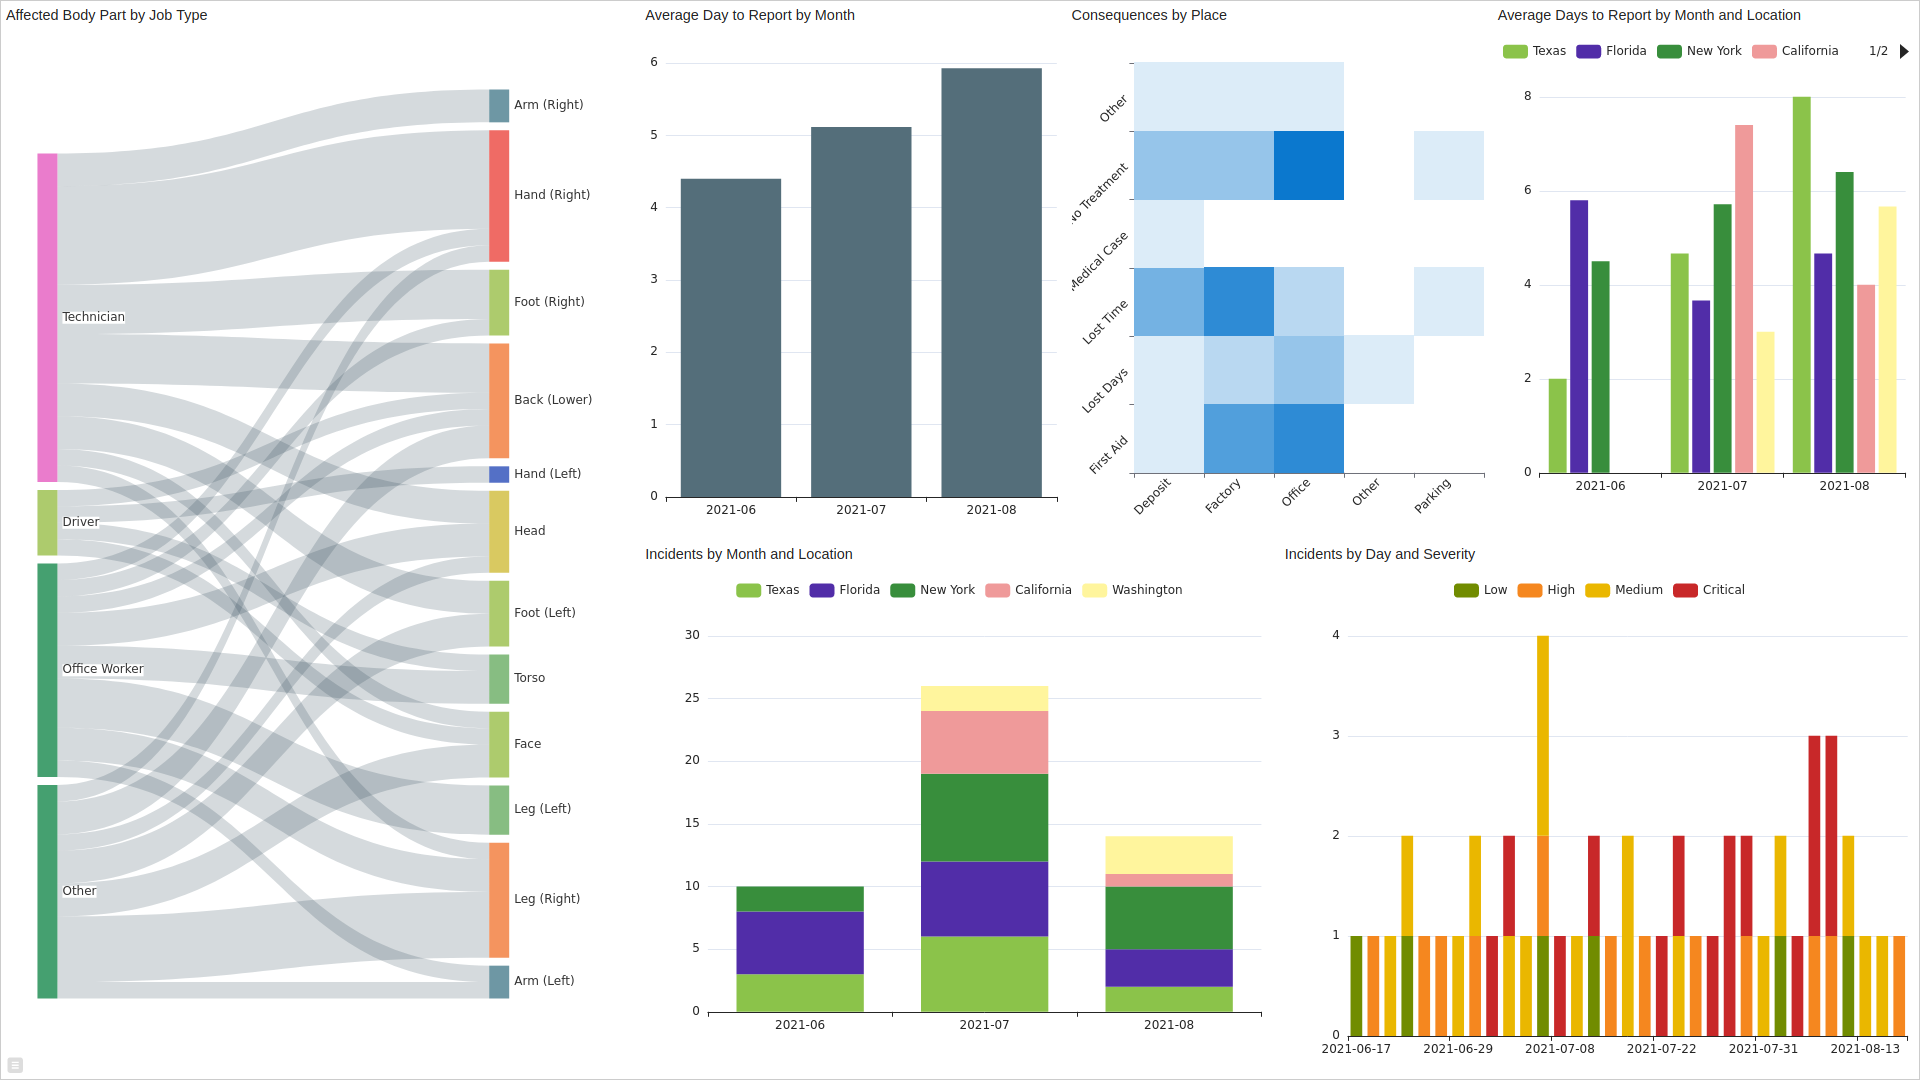
7. Affected Body Part by Job Type
Create Group By
Create a new card by selecting the + button below the Select card and pick the Group By card type.
Configure Group By
Drag the Output column Body Part from the Select card and drop it in Select value.
Set the following aggregation type for each Select field:
Count for Body Part
You can alternatively select the value placeholder and select Body Part from the list that appears.
Drag the Output columns: Body Part and Job Type from the Select card and drop them in the Group By key.
You can alternatively select the key placeholder and select Body Part and Job Type from the list that appears.
The result should look like this:
Select Count Body Part value Group By Body Part Job Type key
Sort the Output table:
Body Part ascending
Job Type ascending
Create Chart
Create a new card by selecting the + button below the Group By card and pick the Chart card type.
Configure Chart
Drag the Output column Body PartCount from the Group By card and drop it in Chart value.
You can alternatively select the value placeholder and select Body PartCount from the list that appears.
Drag the Output columns: Job Type and Body Part from the Group By card and drop them in the By key.
You can alternatively select the key placeholder and select Job Type and Body Part from the list that appears.
The result should look like this:
Chart Body PartCount value By Job Type Body Part key
Select Sankey on the chart type selector.