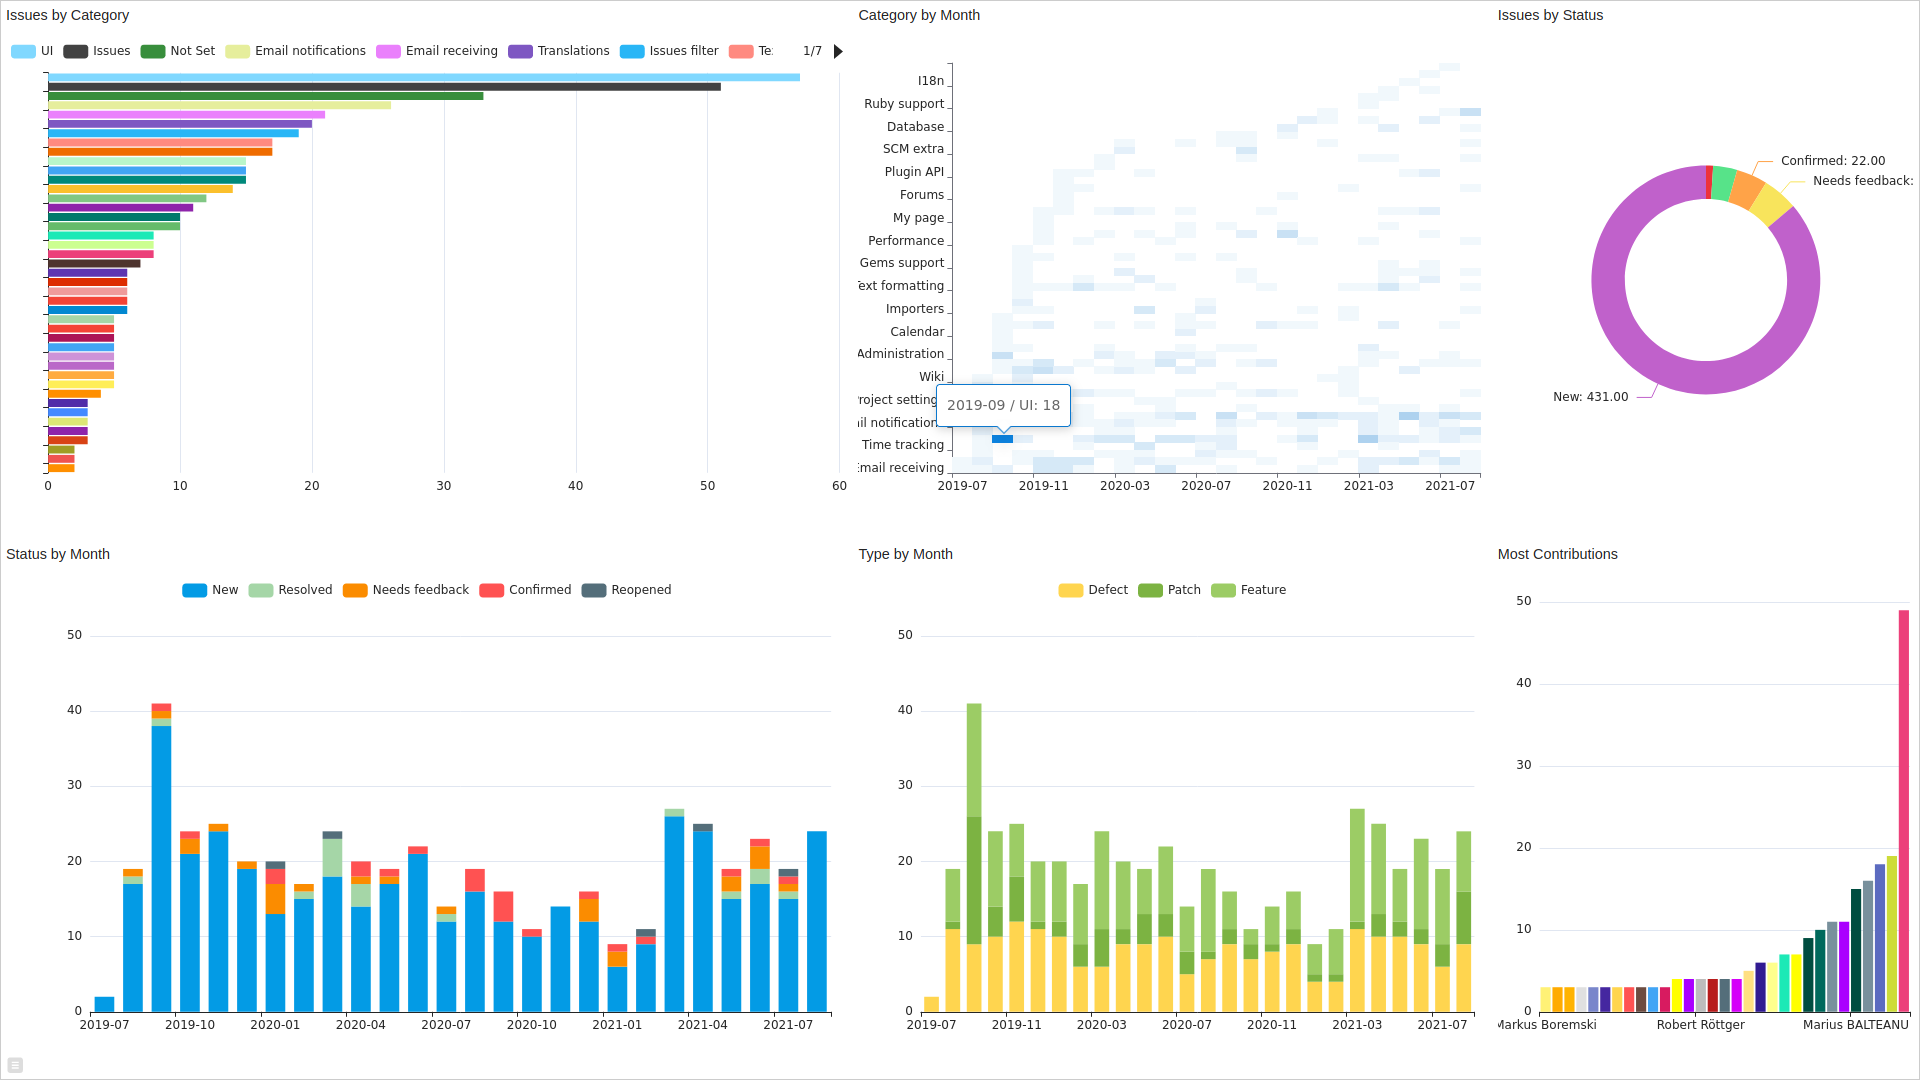
Make No Code Dashboards from JSON Files: Part 1
Go back to the JSON Guide Introduction
💭 Would you like to go over this topic with an instadeq specialist?
📅 Book a Call Free of Charge
Create and Name New Deck
Select the button on the top bar to create a new deck.
Select the current name and enter a descriptive name like "Redmine Issues Dashboard".
Create JSON Source Card
On the empty card select the card type JSON File.
Load New Data from File
Drop the redmine_500_issues.json file in the drop area or click on it to open the file picker and select it from there.
Select the button when asked if you want to Store in Channel? this will load the current content when the card loads as a deck or as a dashboard, if you load new data and store it in the channel the new data will load on anyone that has decks or dashboards open that depend on this source.
Collect Needed Fields in the Basket
We need to drag and drop many fields from the JSON File card to the Select card, to make it easier we are going to first collect all required fields in the Basket and then drop them.
Open the basket by selecting the basket icon at the top left of the screen.
Drag the following fields from the JSON output and drop them in the basket area that appears at the top of the screen:
Drag name from issues 0 priority name
Drag name from issues 0 author name
Drag name from issues 0 status name
Drag name from issues 0 tracker name
Drag name from issues 0 category name
Drag created_on from issues 0 created_on
Create Select Card
Create a new card by selecting the + button below the JSON File card and selecting the Select card type.
Convert Data to a Table
We need to convert the nested fields we collected into a table, for that we are going to drop them one by one from the basket into the Select value placeholder.
If you want the Select card to be closer to the basket at the top a trick is to create a new empty card below the Select card so that it pushes the Select card to the top of the screen.
Rename Input Fields
The generated names for the inputs are long, it's better to rename them.
Select each input name on the top left of the Select card and then select the button that appears to its right.
Give each input a descriptive name, like:
Priority
Author
Status
Created On
Tracker
Category
Get All Fields as Rows
By default the inputs will be for the first item in the issues list, we need to generate a table with all issues, for that we need to change the list item index in the input from 0 to all ( 0:∞ ).
Select the index path item ( 0 ) for each input and select the range alternative 0:∞ in the alternatives dialog that opens, then select the button. Do this for all inputs.
Create Month Column with Format Date Function
The Created On input has the complete date and time for the issue in a format that is "Computer Friendly" we want to transform it to display the year and month only.
For that we select the + button on the top right of the Select card, select the calc1 field that appears and select the button on it to give it a better name like Month.
We now need to create a formula to format the input date from Created On into year and month, to do that select the formula to the right of the calculated field (it should be a 0 by default) to open the formula editor.
Go to the Σ function section on the formula editor and search for the word format.
Select the format date: 2021-08-11T08:57:16.868Z with: yyyy-MM-dd HH:mm:ss entry to replace the currently selected formula (the value in the date parameter may be different, it's just an example).
Select the with: parameter by selecting the word with: or its value to the right, notice that the focus underline will cover just that parameter. In the "text" section of the formula keyboard replace yyyy-MM-dd HH:mm:ss for yyyy-MM.
We need to apply this formula to the Created On input, to do that we need to make that input the value for the format date: parameter, to do that there are two ways:
-
Select the date: parameter by clicking on it or the value to its right
Select Created On from the list at the bottom of the keyboard
Drag Created On from the input list at the top right and drop it over the date: parameter (over the date: word or the value to its right)
Issues by Status Donut Chart
First we need to count issues by status, for that we need to create a Group By card below the Select, then drag the Status column from the Select card into the Select value placeholder and change the operation from Last to Count. Next we drag the Status input from the Select or the input section and drop it into the Group By key placeholder.
You can sort by StatusCount by selecting the sort icon to the right of the table column to cycle through:
Unsorted
Sort Ascending
Sort Descending
Now we can create the chart, create a new card below the Group By and select the Chart card type.
Drag StatusCount from the Group By output table to Chart value placeholder and the Status table column to the By key placeholder.
You can also select on the value placeholder and select the column from the list that appears below and do the same by selecting the key placeholder.
Change the chart type to Pie and open the toggle settings + button to the right of the chart type selector to expand the chart settings.
Decrease the Radius close to 60 and increase the Inner Radius close to 45.
Close settings by selecting - again.
Custom Status Colors with Dictionary Card
To map Status names to colors we are going to use a Dictionary card. Create it between the Group By and the Chart card and select the text type option.
Remove the existing entry by selecting the button on the right and then drag the Status column from the Group By above and drop it in the Dictionary card to autofill the entries.
Select each color and change it to value related to the status name.
After selecting the colors give the Dictionary a more descriptive title by double clicking the card title and writing the new title, something like Status to Color should work.
Then drag the Dictionary by draging from the drag icon from the top left or bottom left of the card and drop it into the highlighted area of the Chart card.
You can make sure that the dictionary was linked to the card by going to the bottom right of the Chart and checking if there's a icon, you can select it to see and manage linked dictionaries.
Finally we need to change the Color chart setting from the default to a function that will provide the Status as input and get the color associated with that status in the dictionary we just created. To do that click the λ to select the current formula, notice that the underline highlights the complete formula.
Search for the word dictionary and select the function lookup in dictionary: and select the dictionary in the drop down box.
Select the key: argument and select the Status input from the list at the bottom, then select the or default: argument, go to the next group of sections by selecting the tab in the formula keyboard and the color section to pick a default color when the dictionary doesn't contain the provided status.
Issues by Category Bar Chart
Create a Group By card below the Select, then drag the Category column from the Select card into the Select value placeholder and change the operation from Last to Count. Next drag the Category input from the Select or the input section and drop it into the Group By key placeholder.
Sort by CategoryCount descending
Create a Chart card below the Group By.
Drag CategoryCount from the Group By to the Chart value placeholder.
Drag Category from the Group By to the By key placeholder.
Open the chart's settings by selecting the toggle settings + button to the right of the chart type selector.
Set Orientation to Horizontal.
To remove the Y Axis Label select the Y Label tab and remove the Y Label Format content and enable the Inverse option.
Make the left margin smaller by going to the Margin section and setting Margin Left to 5.
Changing Label for Not Set Category
There are issues with category having the special Not Set value, in the chart they appear as null, we would like to give it a better label.
To do that select the Category input to the right of the Category chart setting to open the formula editor.
In formula keyboard's Logic section select the if key.
Drag Category from the input or the query and drop it to the left side of the = comparison. You can also achieve this by selecting the 1 to give it focus and select Category from the list at the bottom of the formula keyboard.
Select the 2 to the right of the =, go to the Logic 1 < 2 section and select Not Set.
Select the equals text to the right of then and replace the current value for Not Set or similar.
Drag Category and drop it to the over not equals (to the right of else).
Close the formula keyboard by selecting .
Naming Cards
Double click on card titles to give descriptive names, at least for Chart cards since the titles will be displayed in the final dashboard.
For Group By cards you can double click while holding Ctrl/Cmd key to let instadeq generate a descriptive title based on the query configuration.
Biggest Contributors Bar Chart
Create a Group By card below the Select, then drag the Author column from the Select card into the Select value placeholder and change the operation from Last to Count. Next drag the Author input from the Select or the input section and drop it into the Group By key placeholder.
Sort by AuthorCount descending
Create a Chart card below the Group By.
Drag AuthorCount from the Group By to the Chart value placeholder.
Drag Author from the Group By to the By key placeholder.
Give descriptive titles to both cards.
Filter Small Contributors
To filter small contributors we want to filter all contributors with 2 or less contributions.
To do that we drag the AuthorCount input to the Where condition placeholder, select the = operator in the condition and select > in the formula keyboard to replace it. Select the number to the right of the >, clear its content using the remove ⌫ button until we get 0, then select the number 2 on the formula keyboard.
Issues by Type by Month Stacked Chart
Create a Group By card below the Select, then drag the Tracker column from the Select card into the Select value placeholder and change the operation from Last to Count. Next drag the Tracker input from the Select or the input section and drop it into the Group By key placeholder.
Sort by Month asscending
Create a Chart card below the Group By.
Drag TrackerCount from the Group By to the Chart value placeholder.
Drag Month and Tracker from the Group By to the By key placeholder.
Give descriptive titles to both cards.
Issues by Status by Month Stacked Chart
Create a Group By card below the Select, then drag the Status column from the Select card into the Select value placeholder and change the operation from Last to Count. Next drag the Status input from the Select or the input section and drop it into the Group By key placeholder.
Sort by Month asscending
Create a Chart card below the Group By.
Drag StatusCount from the Group By to the Chart value placeholder.
Drag Month and Status from the Group By to the By key placeholder.
Give descriptive titles to both cards.
Issues by Category by Month Heatmap Chart
Create a Group By card below the Select, then drag the Category column from the Select card into the Select value placeholder and change the operation from Last to Count. Next drag the Category input from the Select or the input section and drop it into the Group By key placeholder.
Sort by Month asscending
Create a Chart card below the Group By.
Drag CategoryCount from the Group By to the Chart value placeholder.
Drag Month and Category from the Group By to the By key placeholder.
Select the Heatmap chart type on the chart selector.
To have the dates on the X Axis open the chart's settings by selecting the toggle settings + button to the right of the chart type selector and reverse the values for Category and Category:
Drop Month over Category's current value ( Category )
Drop Category over Sub Category's current value ( Month )
Give descriptive titles to both cards.
Create Dashboard with Layout Card
Create new Layout card and give it a descriptive title like "Redmine Issues Dashboard" since it's going to be used in the share dialog.
Use Filters to See Charts Only
We need to drag all charts and drop them on empty layout panels to later arrange them, to shorten the distance for each drag we can either add all chart cards into the or we can use the feature to show only "visual" cards.
To do the later select the on the top left of the screen, on the panel that opens deselect all filters that are not , you can do it one by one or reverse selection twice by clicking the while holding the Ctrl/Cmd key.
Create Dashboard Layout
To have the chart cards even closer we can collapse them all by selecting the collapse button on the top right of any card while holding the Ctrl/Cmd key and then expanding the Layout card again by selecting the button on it.
Now drag all chart cards from the drag handle and drop each on an empty layout panel.
Once in the layout you can move panels by dragging the drag handle on the top left of the panel and dropping it on an empty layout panel.
To resize panels drag the resize handle icon on the bottom right of the panel and drop it in an empty panel to resize it up to that panel.
Preview Dashboard
When the layout is finished you can preview it by opening the card's actions by selecting the icon on the top right and selecting the set to read only button.
To go back to edit mode open the card's actions again and this time select the set to edit more button.