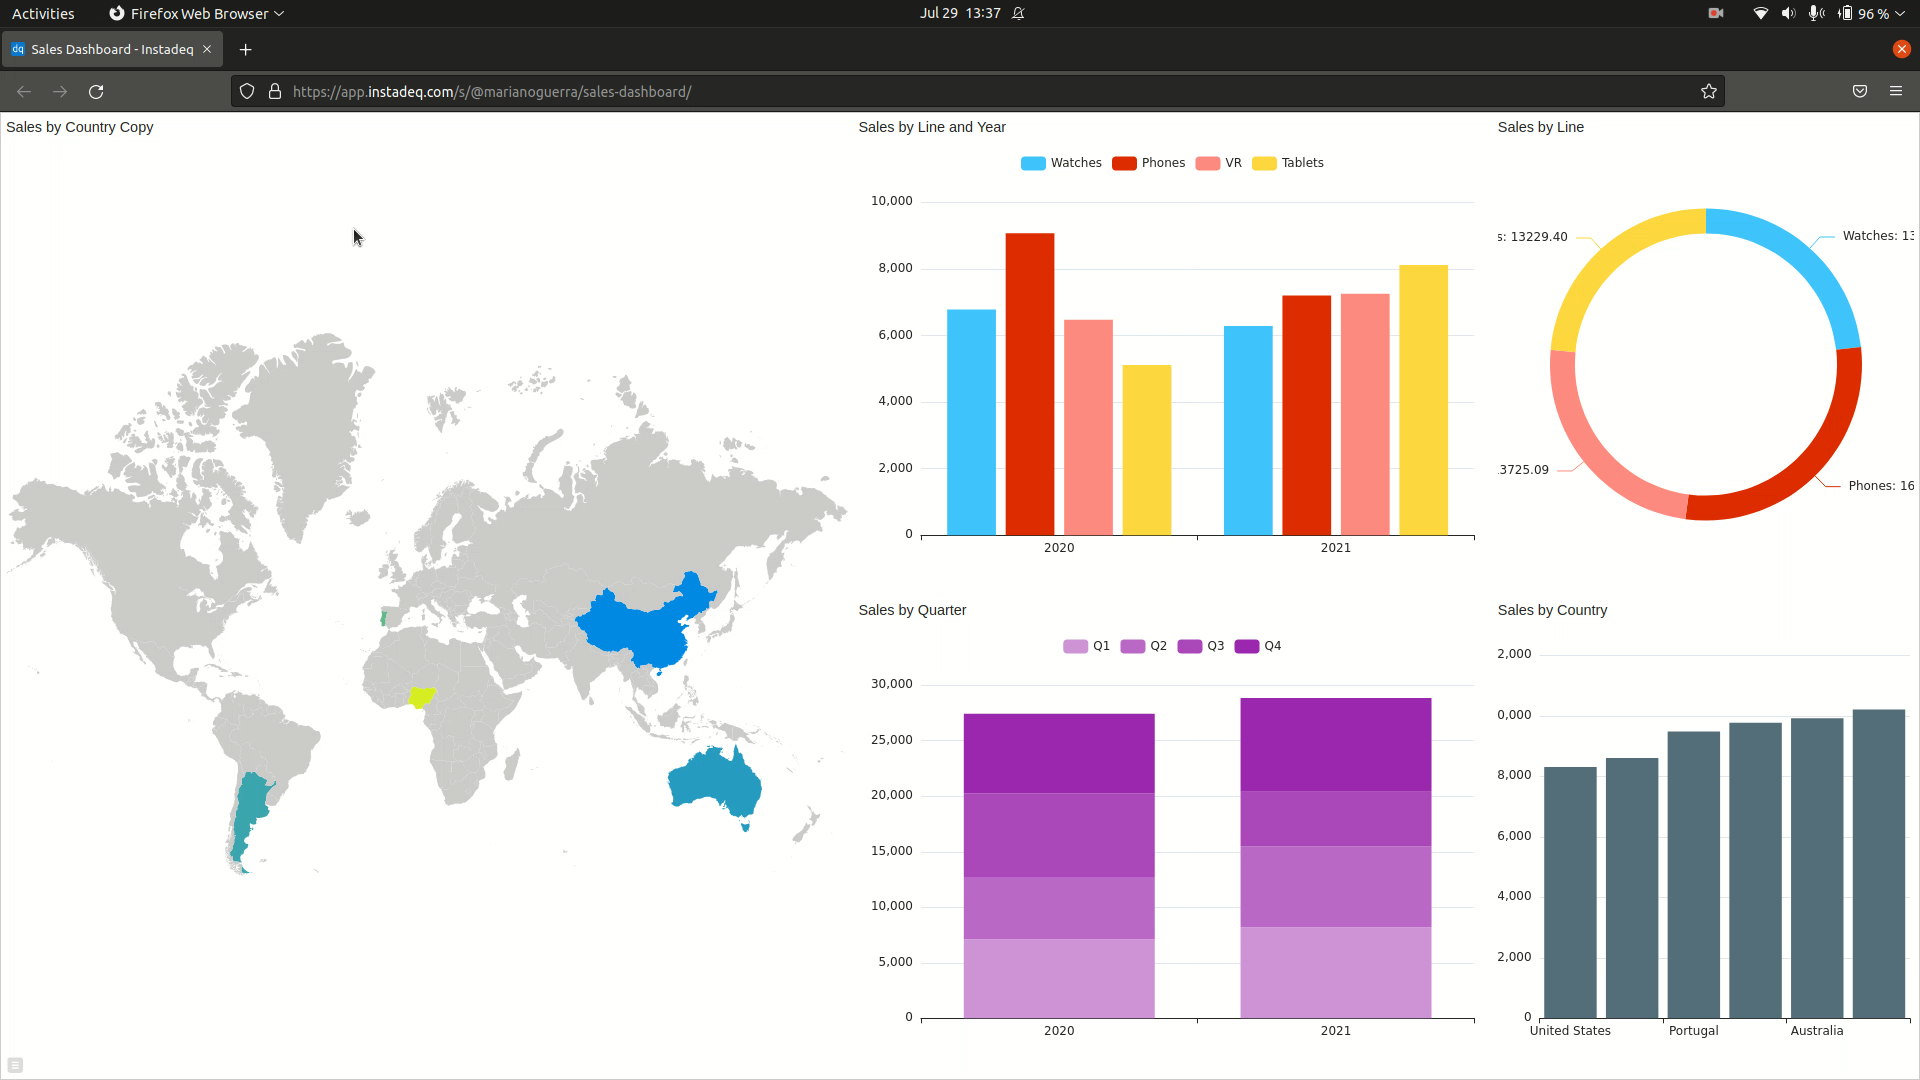
Make No Code Dashboards from CSV Files: Part 1
Go back to the CSV Guide Introduction.
💭 Would you like to go over this topic with an instadeq specialist?
📅 Book a Call Free of Charge
Create and Name a New Deck
Select the new deck button on the top bar to create one.
Select the current name and enter a descriptive name like "Sales Dashboard".
Create a CSV Source Card
On the empty card select the card type CSV File.
Load New Data from a File
Drop the sales-data.csv file to the drop area or click on it to open the file picker and select it from there.
Select the button when asked if you want to Store in Channel? this will load the current content when the card loads as a deck or as a dashboard.
It will also notify anyone viewing a deck or a dashboard depending on this source that there's new data available.
Create Group By: Sum Amount Group By Line
Create a new card by selecting the Add Card + button below the CSV File card and select the Group By card type.
Drag the Amount column from the CSV File card into the Select value placeholder in the Group By card and select the Sum aggregation type to the left of Amount once dropped.
Drag the Line column from the CSV File card into the Group By key placeholder in the Group By card.
Create Pie/Donut Chart: Amount Sum by Line
Create a new card by selecting the Add Card + button below the Group By card and selecting the Chart card type.
Drag the AmountSum column from the Group By above and drop it into the Chart value placeholder in the Chart card.
Drag the Line column from the Group By above and drop it into the By key placeholder in the Chart card.
Select the drop down and select "Pie" chart type.
Select the expand settings + button to the right of the drop down and slide the Inner Radius setting to a value like 65.
You can collapse the chart settings by selecting the collapse settings + button next to the chart type drop down.
Create Group By: Sum Amount Group By Country
Create a new card by selecting the Add Card + button below the CSV File card and selecting the " Group By card type.
Drag the Amount column from the CSV File card into the Select value placeholder in the Group By card and select the Sum aggregation type to the left of Amount once dropped.
Drag the Country column from the CSV File card into the Group By key placeholder in the Group By card.
Create Bar Chart: Amount Sum by Country
Create a new card by selecting the Add Card + button below the Group By card and selecting the Chart card type.
Drag the AmountSum column from the Group By above and drop it into the Chart value placeholder in the Chart card.
Drag the Country column from the Group By above and drop it into the By key placeholder in the Chart card.
Select the expand settings + button to the right of the drop down.
Deselect Show Legends.
Sort Bar Chart
Select the sort icon to the right of the AmountSum column after the bar chart to sort by amount ascending .
Set Color for Bars in Bar Chart
Open the formula editor by clicking the Color chart setting label.
Select the "Go to next sections" button to the right of the formula editor keyboard tabs and select the colors section, pick a color to replace the current formula with a fixed color.
Create Group By: Sum Amount Group By Year and Quarter
Create a new card by selecting the Add Card + button below the CSV File card and selecting the Group By card type.
Drag the Amount column from the CSV File card into the Select value placeholder in the Group By card and select the Sum aggregation type to the left of Amount once dropped.
Drag the Year and Quarter columns from the #card CSV File card into the Group By key placeholder in the Group By card.
Sort by Year and Quarter
On the output section of the Group By select once the sort icon to the right of the Year and Quarter columns to sort by year and quarter ascending .
Create Stacked Bar Chart: Amount Sum by Year and Quarter
Create a new card by selecting the Add Card + button below the Group By card and selecting the Chart card type.
Add AmountSum to Chart value). Add Year and Quarter to the By key.
You can add them by drag & drop or by selecting the placeholder and selecting the columns from the list that appears.
Clone Group By: Sum Amount by Year and Line
Clone the " Group By" card with the following configuration:
Select Sum Amount Group By Year Quarter
To do so select the toggle actions icon on the card's top right.
On the actions that appear select the clone button.
On the input section (the top left of the card) select the Quarter input field and select the remove button from the options that appear on the right, confirm the remove action by selecting the remove button again.
Create Grouped Bar Chart: Amount Sum by Year and Line
Create a new card by selecting the Add Card + button below the Group By card and selecting the Chart card type.
Add AmountSum to Chart value. Add Year and Line to the By key.
Clone Chart: Sales by Country in World Map
Clone the Bar Chart card with the following configuration:
Chart Sum Amount By Country
To do so select the toggle actions icon on the card's top right.
On the actions that appear select the clone button.
Select the "Area Map" from the chart type drop down.
Column Summary: Min and Max Amount Sum
Scroll to the Group By card with the following configuration:
Select Sum Amount Group By Country
Drag the AmountSum column to the Summary column the table to create a "Min" summary for the AmountSum column.
Drag it again to create a "Max".
Set Country Color in Range
To use Min and Max summaries for AmountSum you need to add them to the inputs of the chart.
You can add them by dragging from the summary configurations or by selecting the value placeholder and selecting them from there.
To change the color of each country to a color in a range we need to open the formula editor for the Color chart setting, open the chart settings by selecting the expand settings + button to the right of the chart type drop down.
Open the formula editor by selecting the Color setting.
On formula keyboard's formula section enter the word "color" in the search field to filter formulas related to color.
Select the function color for value: 50 from: to: range from: 0 to: 100 to replace the part of the formula that has the focus.
Select the for value: 50 parameter and on the formula keyboard select AmountSum.
Select the from: 0 parameter and on the formula keyboard select AmountSumMin.
Select the to: 100 parameter and on the formula keyboard select AmountSumMax.
Set Chart Titles
Double Click on the chart card titles and get them descriptive titles, note that the titles will appear on the final dashboard.
Create Layout Card
At the end of the deck select the Add Card + button and select the Layout card type.
Add Charts to Layout
Drag all chart cards from the drag handle and drop each on an empty layout panel.
Once in the layout you can move panels by dragging the drag handle on the top left of the panel and dropping it on an empty layout panel.
To resize panels drag the resize handle icon on the bottom right of the panel and drop it in an empty panel to resize it up to that panel.
Give a descriptive title to the layout card by double clicking on the layout card title and entering the new title.