Make No Code Dashboards using R
💭 Would you like to go over this topic with an instadeq specialist?
📅 Book a Call Free of Charge
What is RStudio?
RStudio is an integrated development environment (IDE) for R. It includes a console, syntax-highlighting editor that supports direct code execution, as well as tools for plotting, history, debugging and workspace management.
To install it go to https://www.rstudio.com/products/rstudio/download/
Send data from R script to Instadeq using httr
Watch "How to Send Data to Instadeq Using WebHooks"
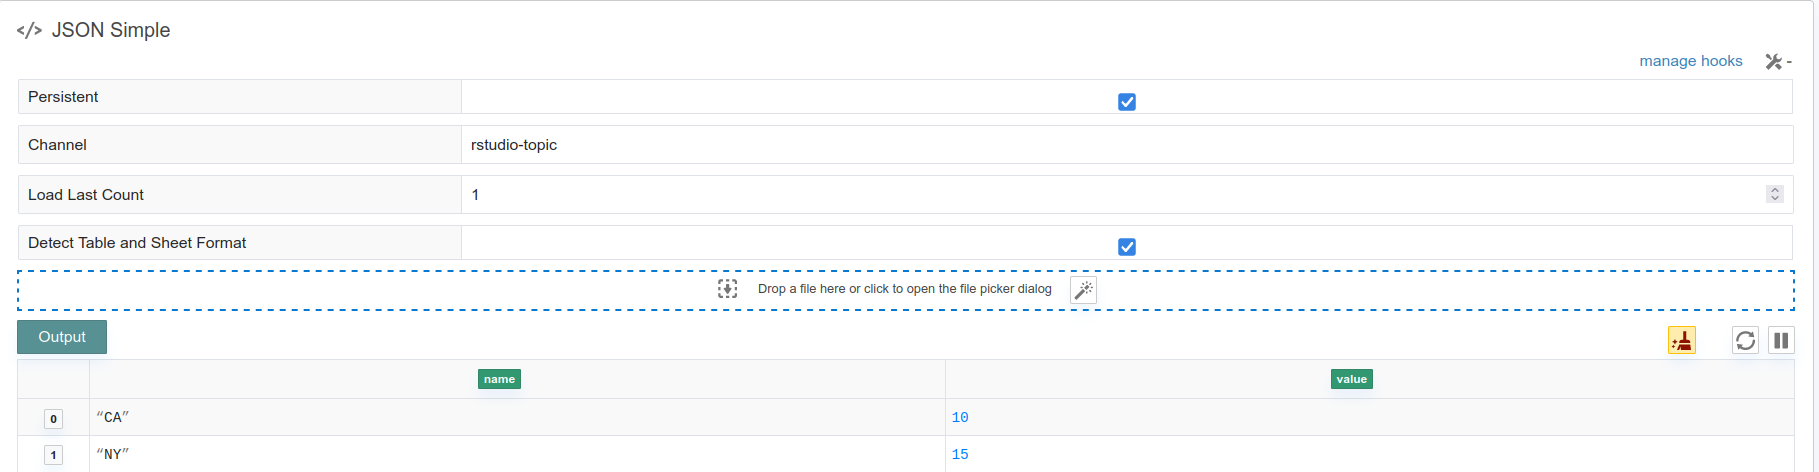
Create a JSON Card and generate a webhook for it
Copy the following code to your R script. Replace '<webhook-url-here>'
library(httr)
webhook_url = '<webhook-url-here>'

body <- '[{
  "name" : "CA",
  "value": 10
}, {
  "name" : "NY",
  "value": 15
}]'

#send data to Instadeq
r <- POST(webhook_url, body = body, encode = "json")

#Response Status must be 200
print(r)
Run it and check your JSON Card on Instadeq
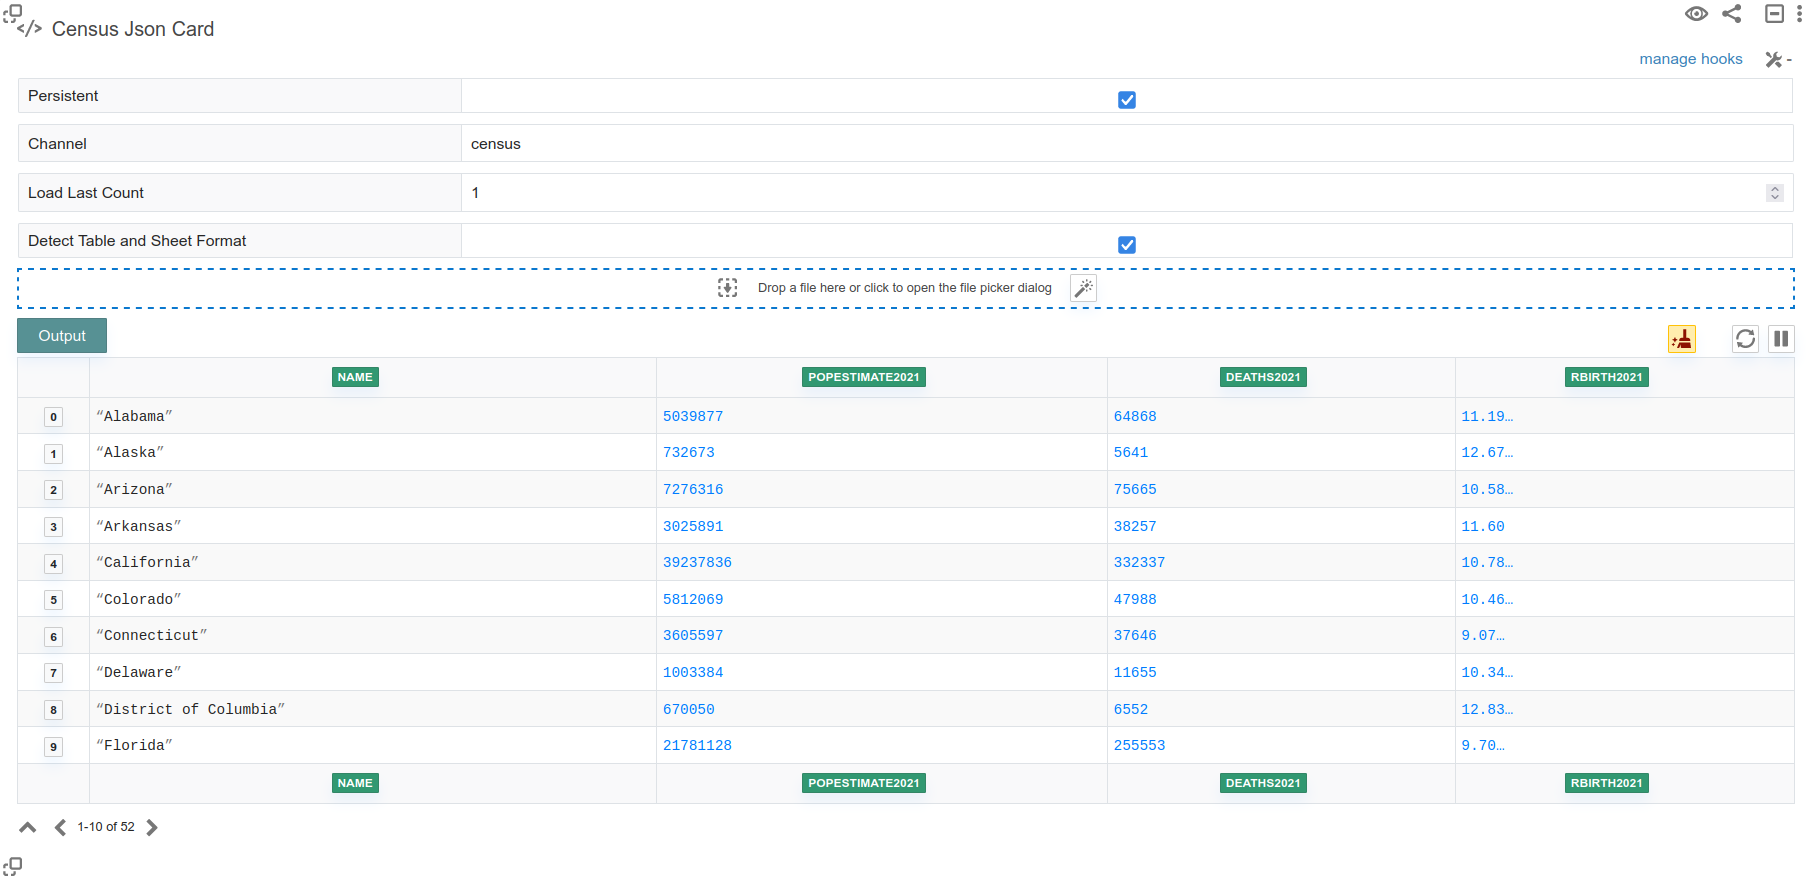
Send data from R Dataframes using the httr and jsonlite modules
To use this example, you can download the United States Census from https://www2.census.gov/programs-surveys/popest/datasets/2020-2021/state/totals/
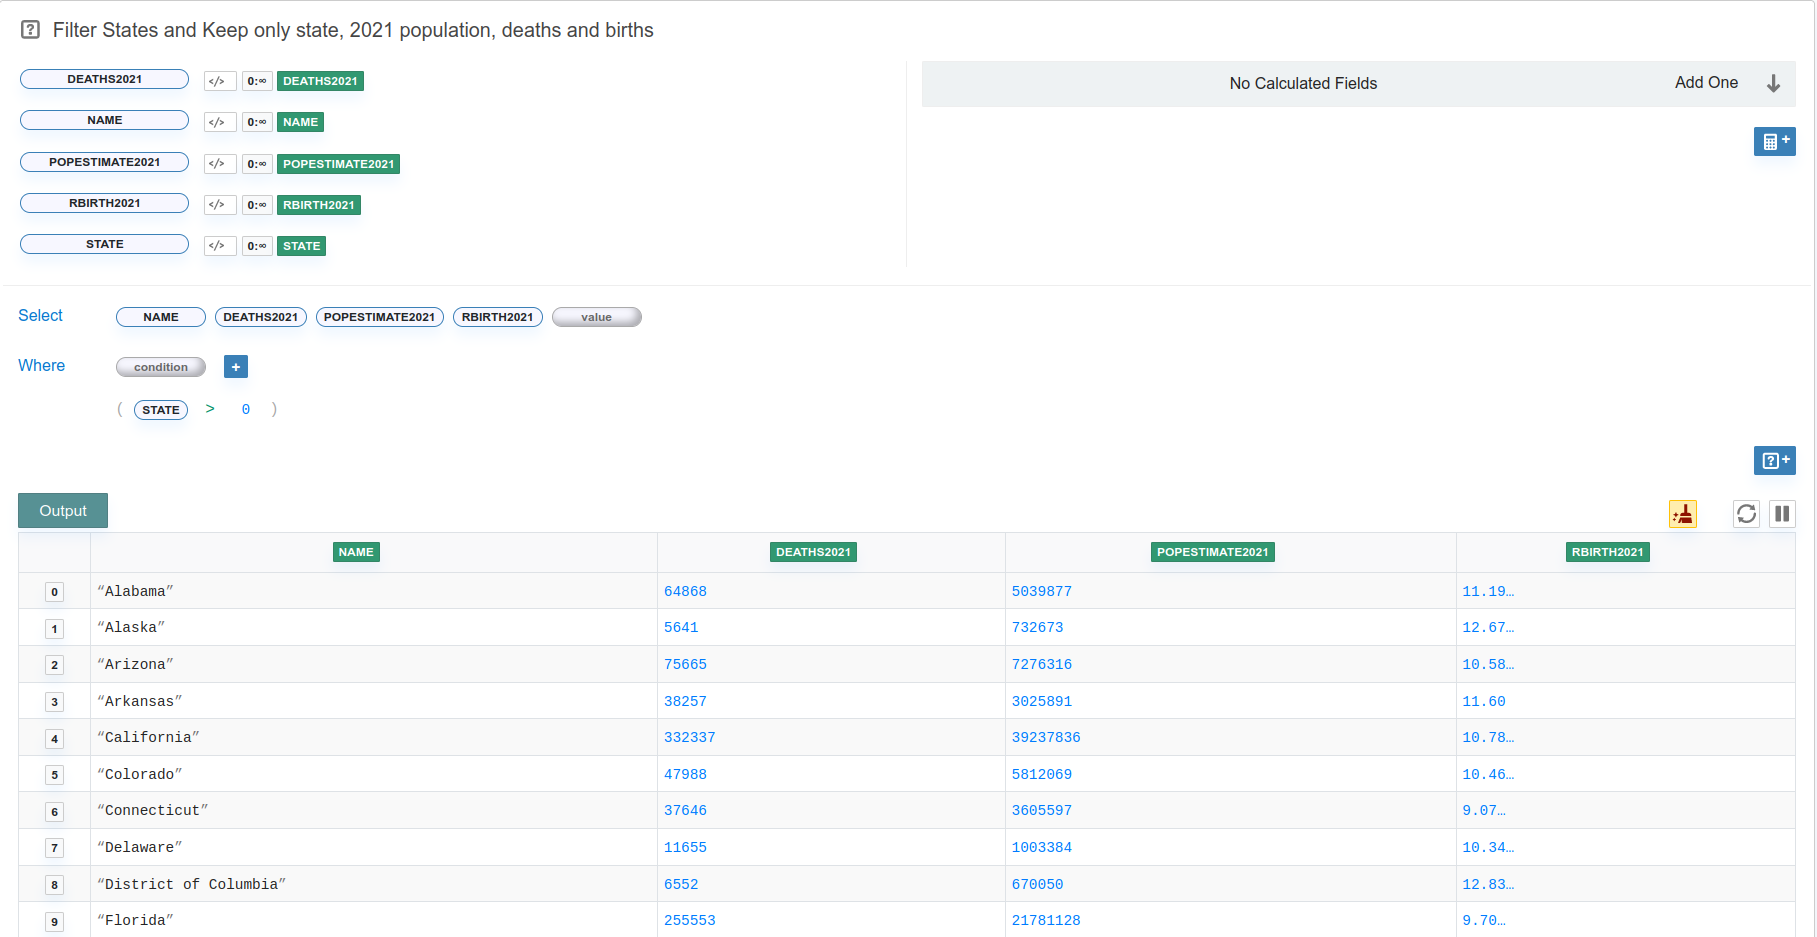
library(httr)
library(jsonlite)

webhook_url = '<webhook-url-here>'

#read your csv file
csv_url = url("https://www2.census.gov/programs-surveys/popest/datasets/2020-2021/state/totals/NST-EST2021-alldata.csv")
df <- read.csv(csv_url, header=T)
#if you have downloaded the file you can use
#df <- read.csv('<csv_file_path>', header=T)

#columns to keep
columns <- c("NAME", "POPESTIMATE2021","DEATHS2021", "RBIRTH2021")

#discard regions and keep only states
#keep only columns with state name, population, deaths and births
#you can also filter rows and discard columns using Instadeq
body = df[df$STATE > 0, columns]

#send data to Instadeq
r <- POST(webhook_url, body = toJSON(body), encode = "json")

#Response Status must be 200
print(r)
Discard regions with "state > 0" and select specific columns using Instadeq
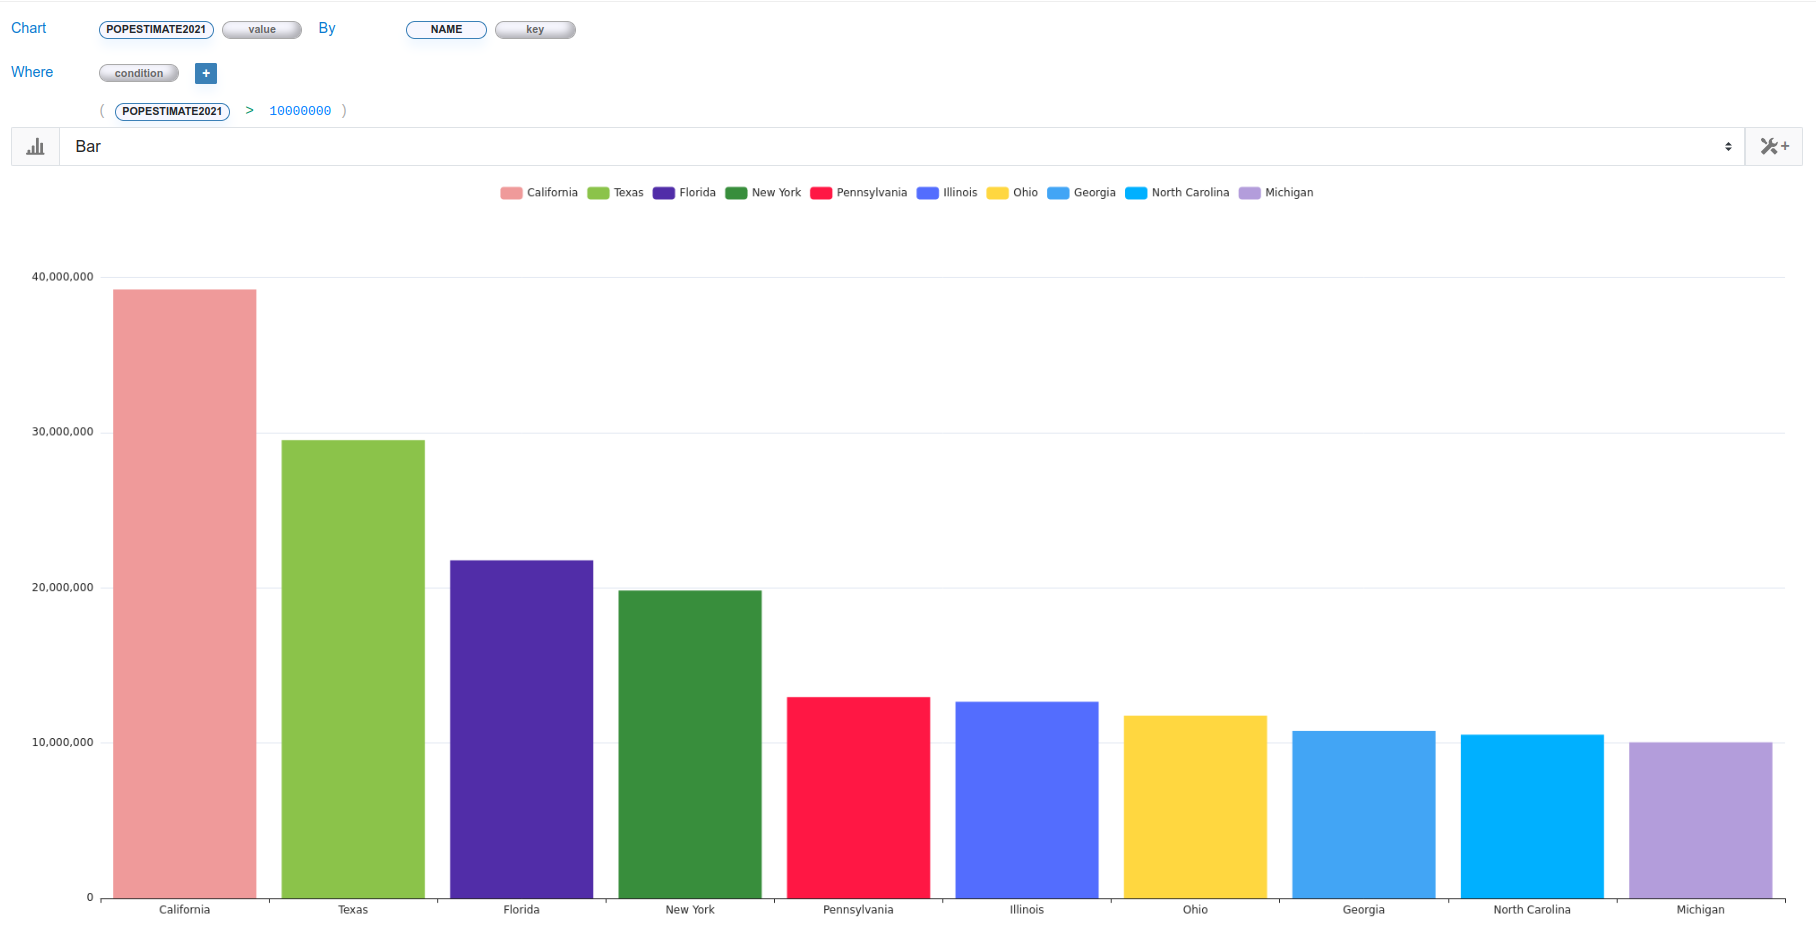
Create a Bar Chart for States with Population > 10,000,000
💭 Would you like to go over this topic with an instadeq specialist?
📅 Book a Call Free of Charge